Autochartist General
MARKET ANALYSIS

NGC/USD is moving towards a resistance line. Because we have seen it retrace from this level in the past, we could see either a break through this line, or a rebound back to current levels. It has touched this line numerous times in the last 4 days and may test it again within the next 21 hours.
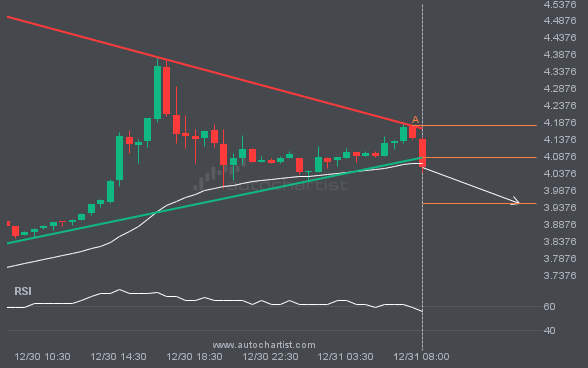
XAUUSD is approaching the support line of a Falling Wedge. It has touched this line numerous times in the last

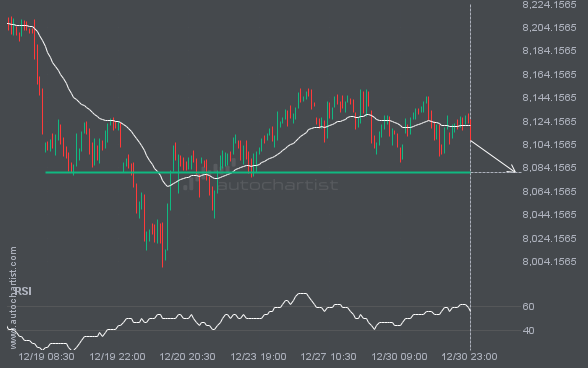
BRN/USD has broken through a support line. It has touched this line numerous times in the last 16 days. This

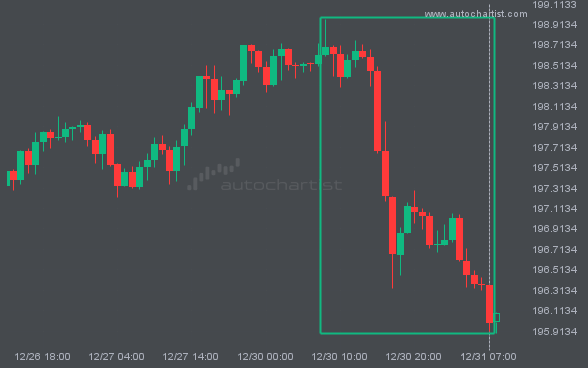
ETHUSD has experienced an extremely big movement in last 6 days. It may continue the trend, but this would make

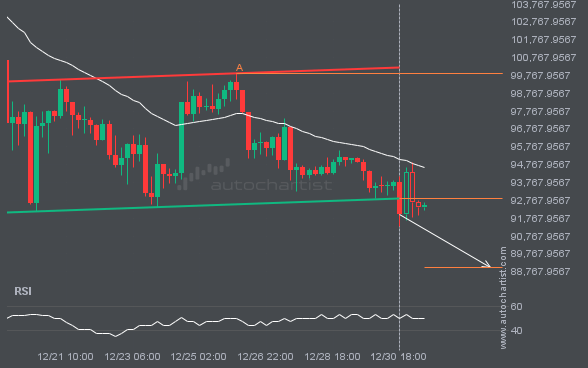
You would be well advised to confirm the breakout that has just occurred – do you believe the move through

Emerging Falling Wedge pattern in its final wave was identified on the EURUSD 4 hour chart. After a strong bearish

NGC/USD is moving towards a resistance line. Because we have seen it retrace from this level in the past, we

The last 9 1 hour candles on GBPJPY formed a Channel Up pattern and broken out through the pattern lines,