Autochartist General
MARKET ANALYSIS

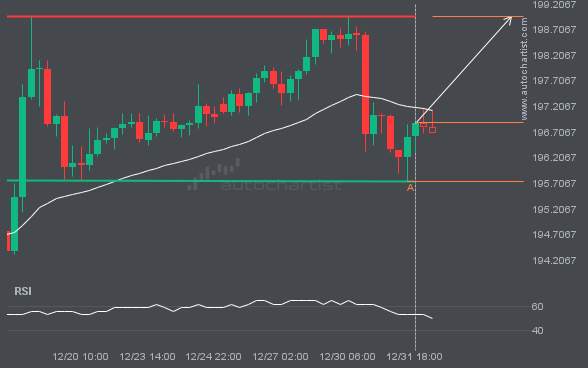
NGC/USD is moving towards a resistance line. Because we have seen it retrace from this level in the past, we could see either a break through this line, or a rebound back to current levels. It has touched this line numerous times in the last 4 days and may test it again within the next 21 hours.
Emerging Rising Wedge pattern in its final wave was identified on the ETHUSD 30 Minutes chart. After a strong bullish

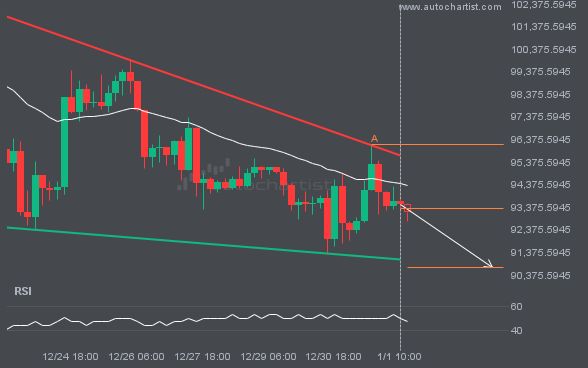
Emerging Channel Down pattern in its final wave was identified on the EURUSD 4 hour chart. After a strong bearish

NAS100 is en route to a very important line that will be a definite deciding factor of what is to

A movement of 7.74% over 16 hours on BTCUSD doesn’t go unnoticed. You may start considering where it’s heading next,

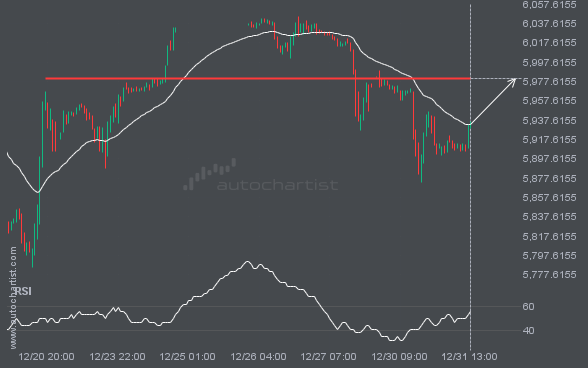
FTSE100 is moving towards a resistance line. Because we have seen it retrace from this level in the past, we

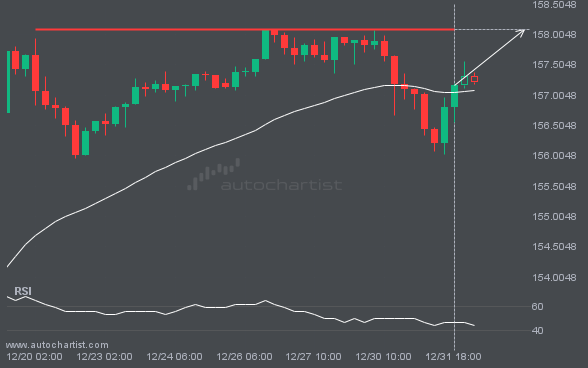
Emerging Rising Wedge pattern in its final wave was identified on the USDJPY 4 hour chart. After a strong bullish