Autochartist General
MARKET ANALYSIS

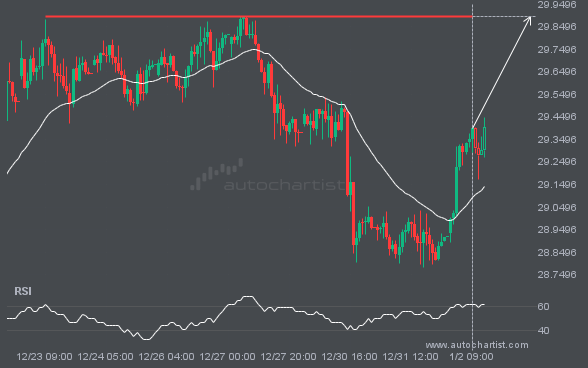
NGC/USD is moving towards a resistance line. Because we have seen it retrace from this level in the past, we could see either a break through this line, or a rebound back to current levels. It has touched this line numerous times in the last 4 days and may test it again within the next 21 hours.
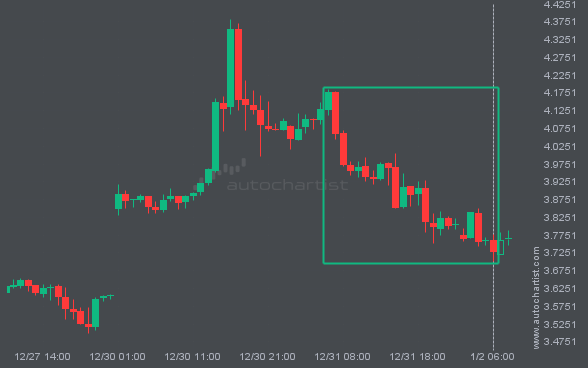
Trend followers are probably eagerly watching FTSE100 to see if its latest 4 consecutive candles continues. If not, the mean-reversion

Emerging Falling Wedge pattern in its final wave was identified on the S&P500 15 Minutes chart. After a strong bearish

A Falling Wedge pattern was identified on XAGUSD at 30.199, creating an expectation that it may move to the support

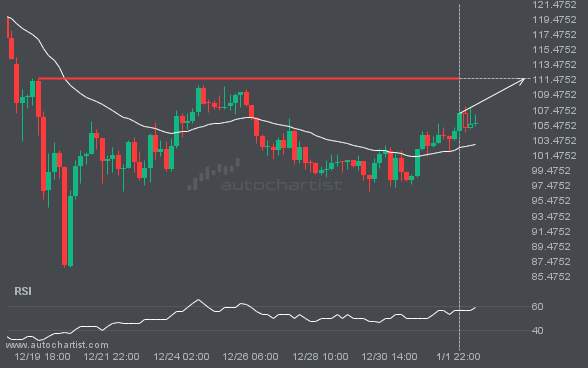
GBPJPY is moving towards a resistance line. Because we have seen it retrace from this line before, we could see

An emerging Rising Wedge has been detected on NGC/USD on the 15 Minutes chart. There is a possible move towards