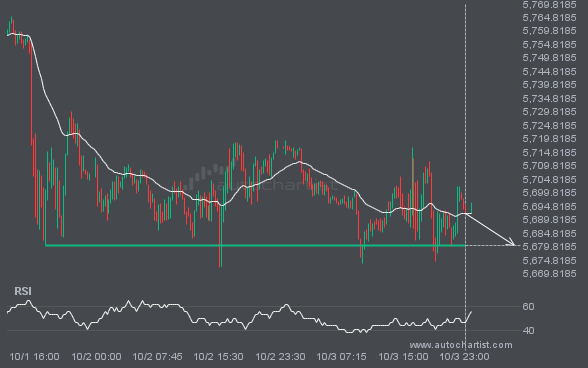
Home » Blog » Supports and resistances are primary concepts of technical analysis. S&P500 is heading for an important price of 5680.3701 – read about what this could mean for the future.
S&P500 is en route to a very important line that will be a definite deciding factor of what is to come! We may see this trajectory continue to touch and break through 5680.3701, unless it runs out of momentum and pulls back to current levels.
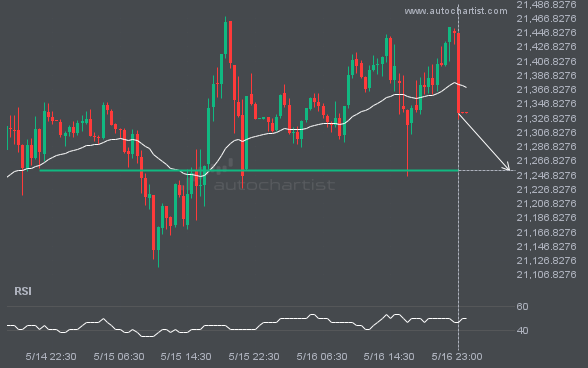
NAS100 is moving towards a line of 21252.6914 which it has tested numerous times in the past. We have seen it retrace from this position in the past, so at this stage it isn’t clear whether it will breach this price or rebound as it did before. If NAS100 continues in its current trajectory, we […]
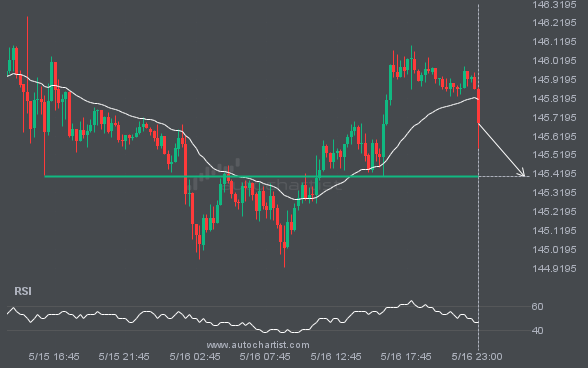
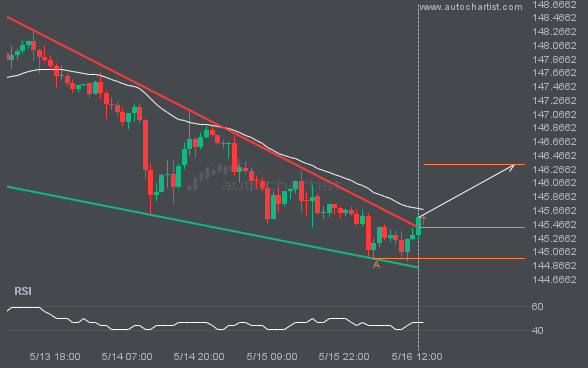
The movement of USDJPY towards 145.4035 price line is yet another test of the line it reached numerous times in the past. We could expect this test to happen in the next 7 hours, but it is uncertain whether it will result in a breakout through this line, or simply rebound back to current lines.
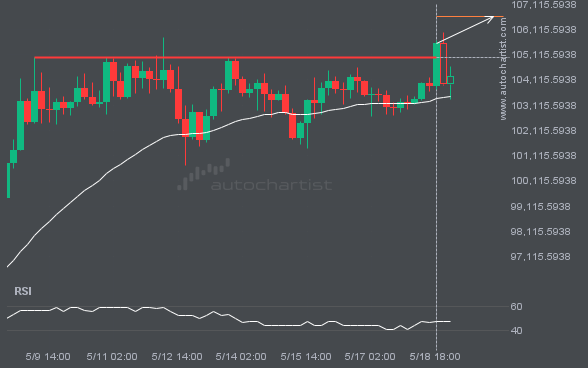
BTCUSD has broken through a line of 105015.1406. If this breakout holds true, we could see the price of BTCUSD heading towards 106618.8359 within the next 2 days. But don’t be so quick to trade, it has tested this line numerous times in the past, so you should probably confirm the breakout before placing any […]
Falling Wedge pattern identified on USDJPY has broken through a resistance level with the price momentum continuing to move in an upward direction. A solid trading opportunity continues with the price expected to reach 146.3369 in the next 21.
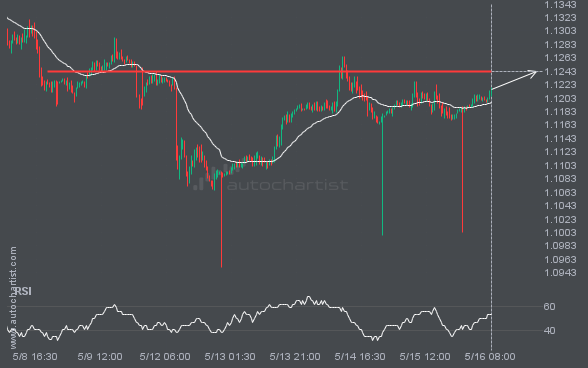
The price of EURUSD in heading back to the resistance area. It is possible that it will struggle to break through it and move back in the other direction. The price may eventually break through, but typically the price retreats from the level a number of times before doing so.
This trade setup on XAUUSD is formed by a period of consolidation; a period in which the price primarily moves sideways before choosing a new direction for the longer term. Because of the bullish breakout through resistance, it seems to suggest that we could see the next price move to 3252.2753.
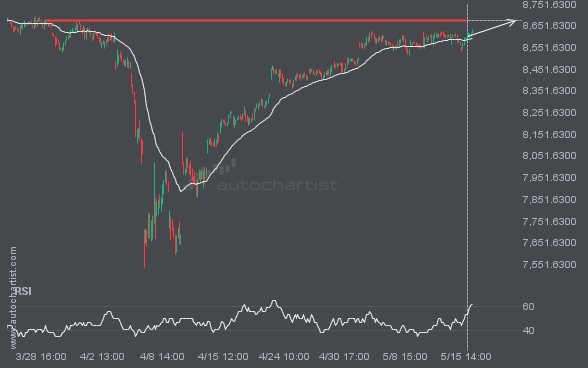
FTSE100 is about to retest a key horizontal resistance level near 8674.9004. It has tested this level 5 times in the recent past and could simply bounce off like it did last time. However, after this many tries, maybe it’s ready to start a new trend.