Home » Blog » Supports and resistances are primary concepts of technical analysis. S&P500 is heading for an important price of 5680.3701 – read about what this could mean for the future.
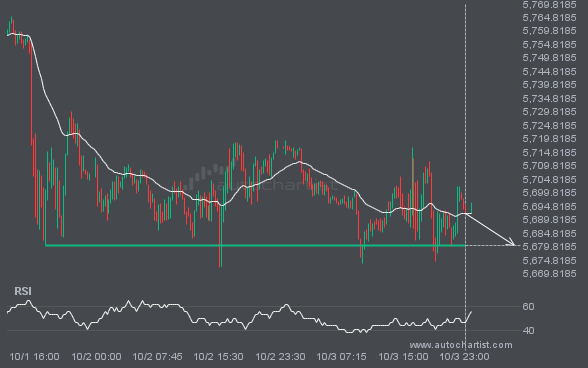
S&P500 is en route to a very important line that will be a definite deciding factor of what is to come! We may see this trajectory continue to touch and break through 5680.3701, unless it runs out of momentum and pulls back to current levels.
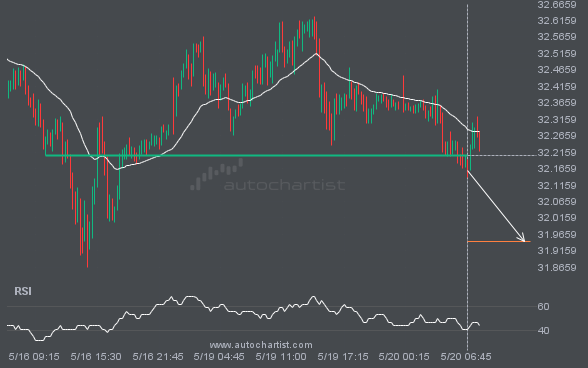
XAGUSD is once again retesting a key horizontal support level at 32.2052. It has tested this level 6 times in the recent past and could simply bounce off like it did last time. However, after this many tries, maybe it’s ready to start a new trend.
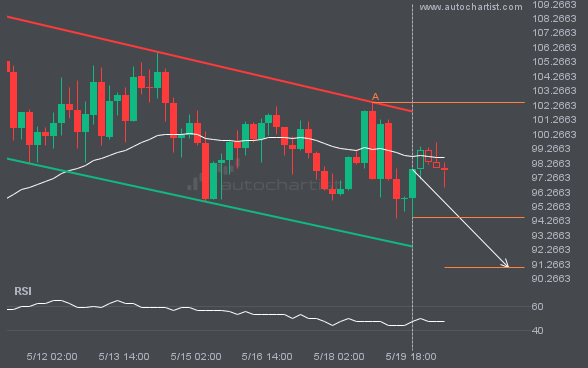
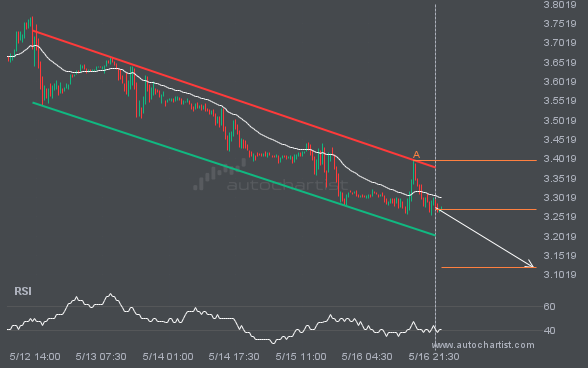
LTCUSD is moving towards a support line which it has tested numerous times in the past. We have seen it retrace from this line before, so at this stage it isn’t clear whether it will breach this line or rebound as it did before. If LTCUSD continues in its current trajectory, we could see it […]
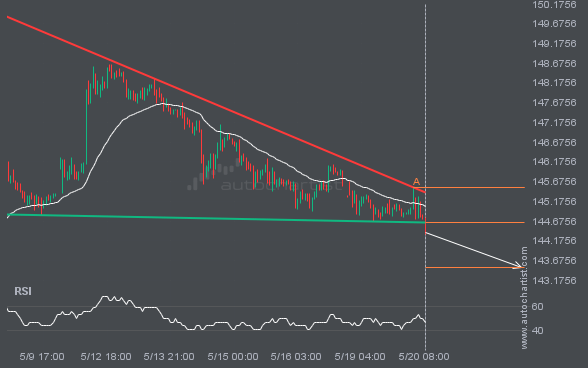
USDJPY has broken through a support line. It has touched this line at least twice in the last 12 days. This breakout may indicate a potential move to 143.4998 within the next 3 days. Because we have seen it retrace from this position in the past, one should wait for confirmation of the breakout before […]
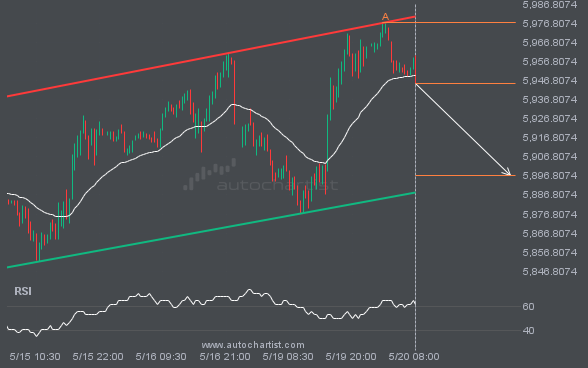
S&P500 was identified at around 5944.95 having recently rebounded of the resistance on the 30 Minutes data interval. Ultimately, the price action of the stock has formed a Channel Up pattern. This squeeze may increases the chances of a strong breakout. The projected movement will potentially take the price to around the 5897.1179 level.
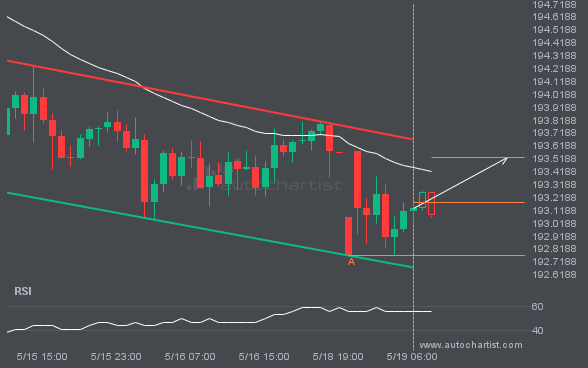
Emerging Channel Down pattern in its final wave was identified on the GBPJPY 1 hour chart. After a strong bullish run, we find GBPJPY heading towards the upper triangle line with a possible resistance at 193.5264. If the resistance shows to hold, the Channel Down pattern suggests a rebound back towards current levels.
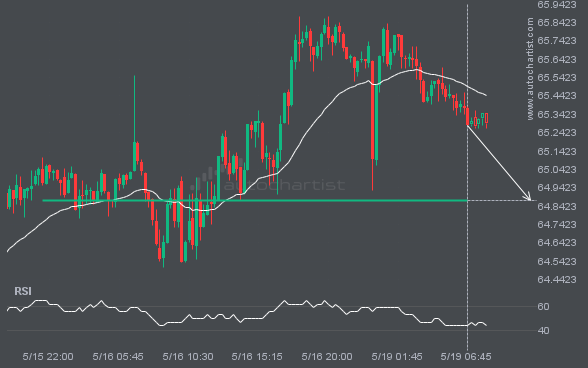
BRN/USD is moving towards a support line. Because we have seen it retrace from this level in the past, we could see either a break through this line, or a rebound back to current levels. It has touched this line numerous times in the last 4 days and may test it again within the next […]
The movement of NGC/USD towards the support line of a Channel Down is yet another test of the line it reached numerous times in the past. This line test could happen in the next 2 days, but it is uncertain whether it will result in a breakout through this line, or simply rebound back to […]