NGC/USD is approaching the resistance line of a Rising Wedge. It has touched this line numerous times in the last 8 days. If it tests this line again, it should do so in the next 2 days.
 Skip to content
 NGC/USD is approaching the resistance line of a Rising Wedge. It has touched this line numerous times in the last 8 days. If it tests this line again, it should do so in the next 2 days.


A movement of 2.21% over 20 hours on NAS100 doesn’t go unnoticed. You may start considering where it’s heading next, a continuation of the current downward trend, or a reversal in the previous direction.
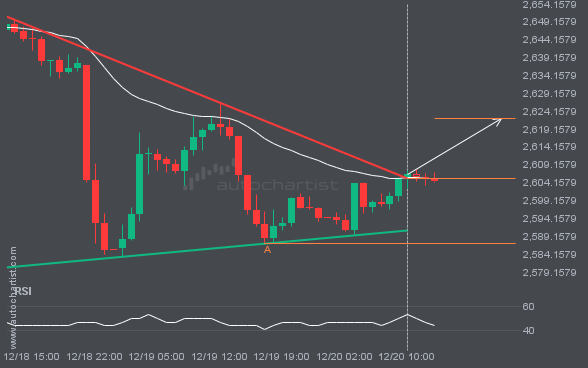
This trade setup on XAUUSD is formed by a period of consolidation; a period in which the price primarily moves sideways before choosing a new direction for the longer term. Because of the bullish breakout through resistance, it seems to suggest that we could see the next price move to 2621.9863.
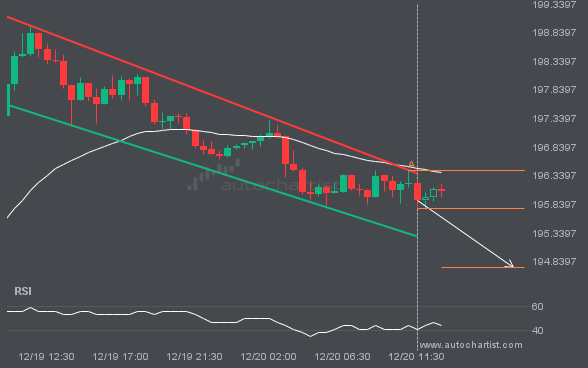
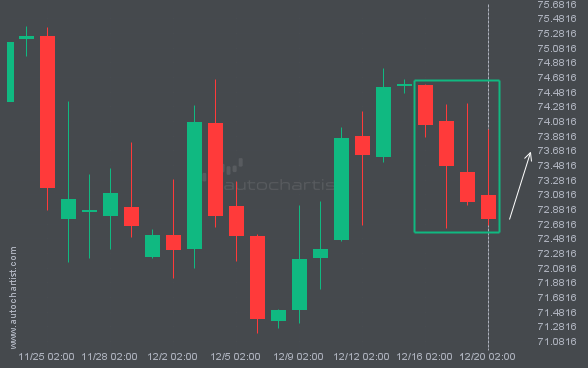
GBPJPY is approaching the support line of a Channel Down. It has touched this line numerous times in the last 2 days. If it tests this line again, it should do so in the next 6 hours.
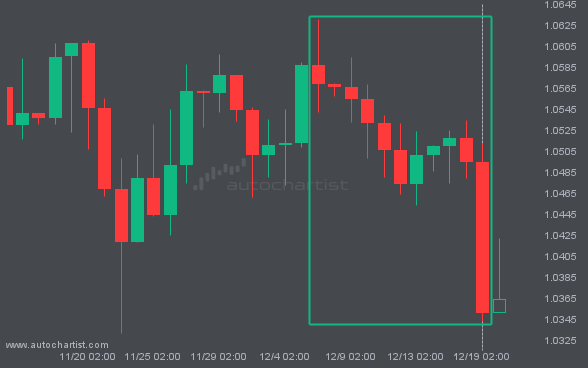
EURUSD experienced an extremely large move that lasted 14. This movement is in the 5.0 percentile and is uncommon. It is not unusual to witness a pullback after such a big movement.
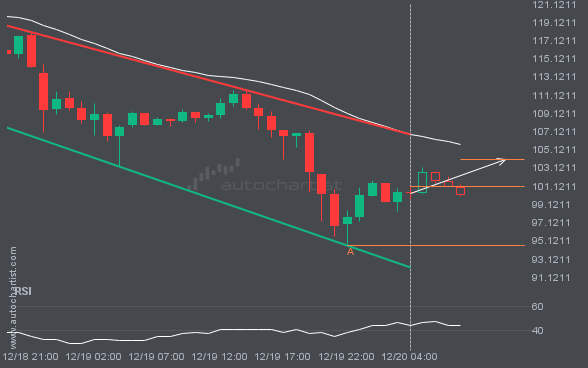
LTCUSD is approaching the resistance line of a Flag. It has touched this line numerous times in the last 4 days. If it tests this line again, it should do so in the next 5 hours.
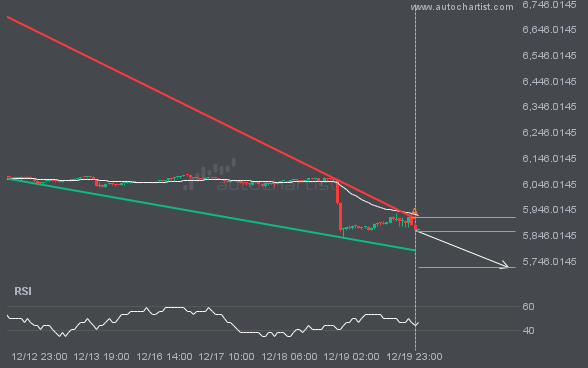
Trend followers are probably eagerly watching BRN/USD to see if its latest 4 consecutive candles continues. If not, the mean-reversion people out there will be delighted with this exceptionally large 5 day move.
S&P500 is trapped in a Falling Wedge formation, implying that a breakout is Imminent. This is a great trade-setup for both trend and swing traders. It is now approaching a resistance line that has been tested in the past. Divergence opportunists may be very optimistic about a possible breakout and this may be the start […]