NGC/USD is approaching the resistance line of a Rising Wedge. It has touched this line numerous times in the last 8 days. If it tests this line again, it should do so in the next 2 days.
FTSE100 is heading towards the resistance line of a Channel Down and could reach this point within the next 2 days. It has tested this line numerous times in the past, and this time could be no different from the past, ending in a rebound instead of a breakout. If the breakout doesn’t happen, we […]
The movement of GBPJPY towards 195.6010 price line is yet another test of the line it reached numerous times in the past. We could expect this test to happen in the next 9 hours, but it is uncertain whether it will result in a breakout through this line, or simply rebound back to current lines.
XAGUSD is trapped in a Falling Wedge formation, implying that a breakout is Imminent. This is a great trade-setup for both trend and swing traders. It is now approaching a resistance line that has been tested in the past. Divergence opportunists may be very optimistic about a possible breakout and this may be the start […]
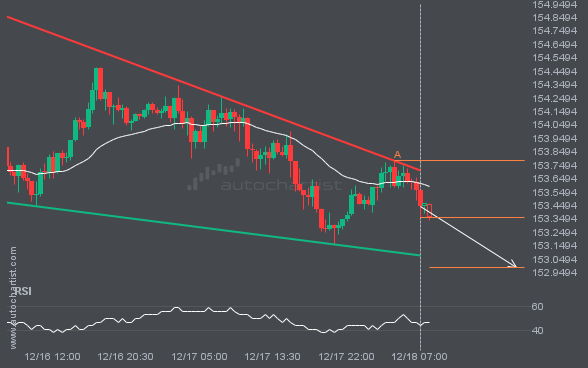
USDJPY was identified at around 153.357 having recently rebounded of the resistance on the 30 Minutes data interval. Ultimately, the price action of the stock has formed a Falling Wedge pattern. This squeeze may increases the chances of a strong breakout. The projected movement will potentially take the price to around the 152.9883 level.
Emerging Channel Up pattern in its final wave was identified on the NAS100 1 hour chart. After a strong bullish run, we find NAS100 heading towards the upper triangle line with a possible resistance at 22387.8400. If the resistance shows to hold, the Channel Up pattern suggests a rebound back towards current levels.
BRN/USD is heading towards a line of 72.5015. If this movement continues, the price of BRN/USD could test 72.5015 within the next 3 days. But don’t be so quick to trade, it has tested this line numerous times in the past, so this movement could be short-lived and end up rebounding.
A Channel Up pattern was identified on GBPJPY at 195.888, creating an expectation that it may move to the resistance line at 198.2835. It may break through that line and continue the bullish trend or it may reverse from that line.