Autochartist General
MARKET ANALYSIS

NGC/USD is moving towards a line of 2.8285 which it has tested numerous times in the past. We have seen it retrace from this position in the past, so at this stage it isn’t clear whether it will breach this price or rebound as it did before. If NGC/USD continues in its current trajectory, we may see it move towards 2.8285 within the next 16 hours.
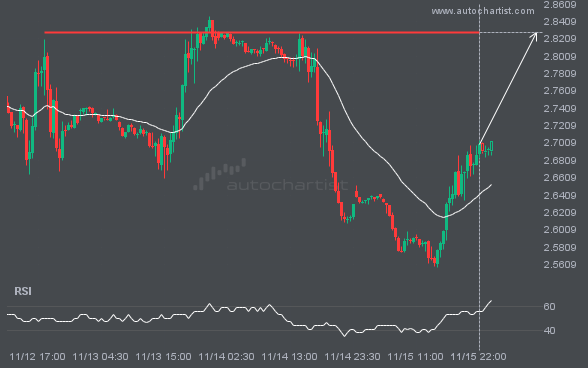
NGC/USD is moving towards a line of 2.8285 which it has tested numerous times in the past. We have seen

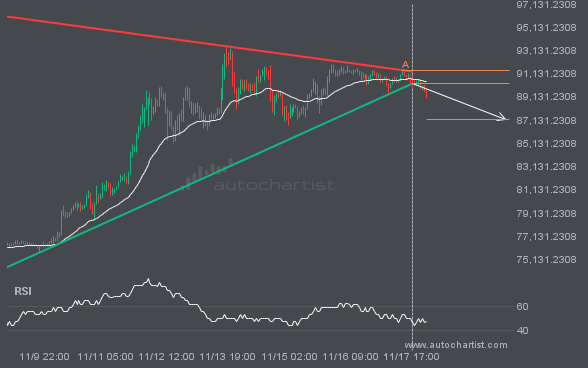
The last 12 1 hour candles on BTCUSD formed a Triangle pattern and broken out through the pattern lines, indicating

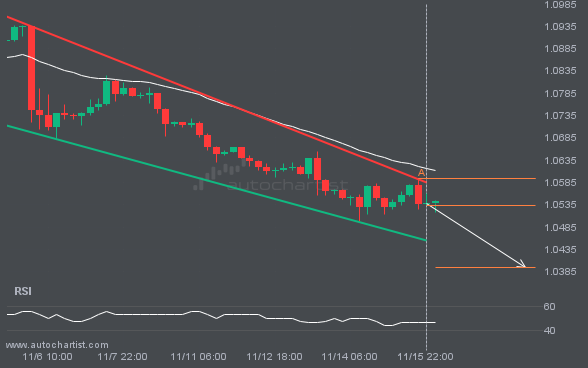
EURUSD is heading towards the support line of a Channel Down. If this movement continues, the price of EURUSD could

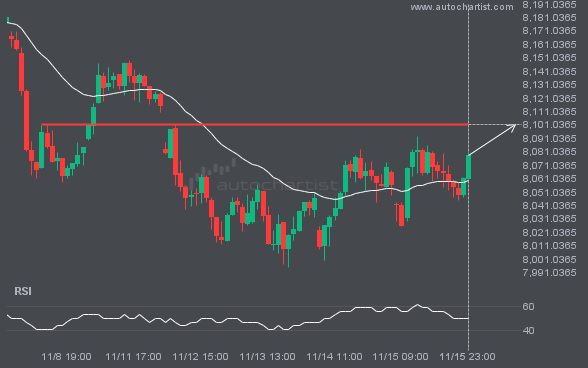
FTSE100 is moving towards a key resistance level at 8101.2998. FTSE100 has previously tested this level 3 times and on

A movement of 1.25% over 21 hours on S&P500 doesn’t go unnoticed. You may start considering where it’s heading next,

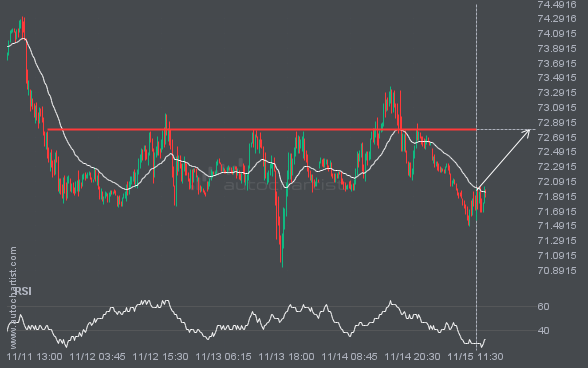
BRN/USD is moving towards a key resistance level at 72.7960. BRN/USD has previously tested this level 3 times and on

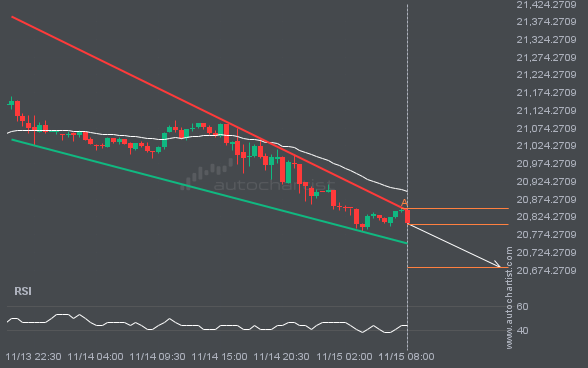
NAS100 is heading towards the support line of a Falling Wedge. If this movement continues, the price of NAS100 could