Autochartist General
MARKET ANALYSIS

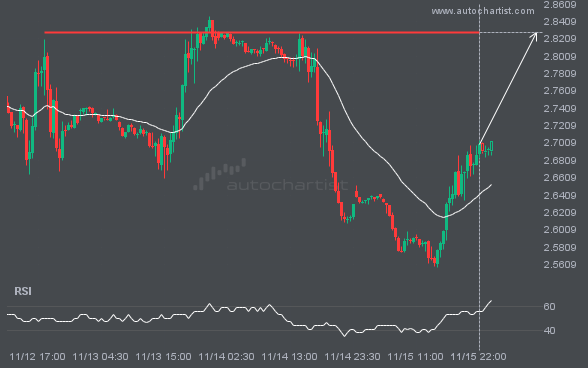
NGC/USD is moving towards a line of 2.8285 which it has tested numerous times in the past. We have seen it retrace from this position in the past, so at this stage it isn’t clear whether it will breach this price or rebound as it did before. If NGC/USD continues in its current trajectory, we may see it move towards 2.8285 within the next 16 hours.
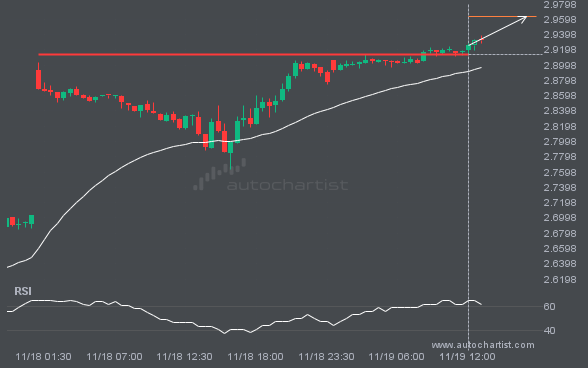
A strong resistance level has been breached at 2.9135 on the 30 Minutes NGC/USD chart. Technical Analysis theory forecasts a

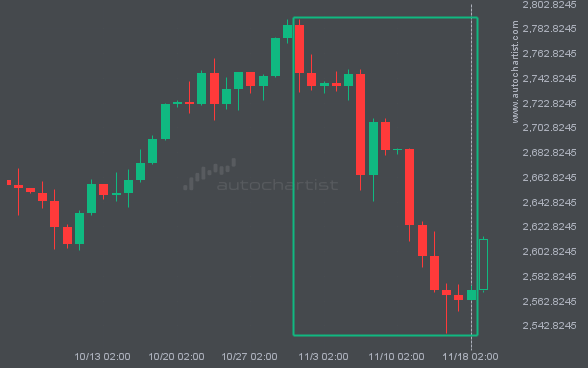
Those of you that are trend followers are probably eagerly watching XAUUSD to see if its latest 6.38% move continues.

BTCUSD rose sharply for 15 days – which is an excessively big movement for this instrument; exceeding the 98% of

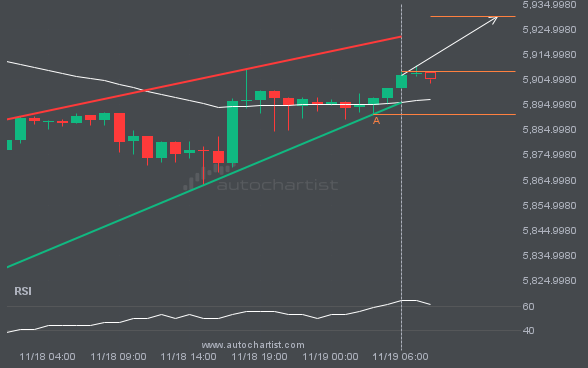
The movement of S&P500 towards the resistance line of a Rising Wedge is yet another test of the line it