...
MARKET ANALYSIS

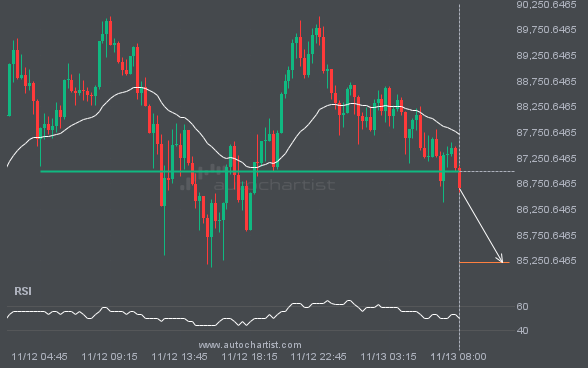
BTCUSD has broken through a line of 86996.5234. If this breakout holds true, we could see the price of BTCUSD heading towards 85222.7344 within the next 6 hours. But don’t be so quick to trade, it has tested this line numerous times in the past, so you should probably confirmation the breakout before placing any trades.

S&P500 is moving toward a support line. Since it has retraced from this line before, we may see either a breakout through this line or a rebound to current levels. It has touched this line numerous times in the last 9 days and may test it again within the next 2 days.

A strong resistance level has been identified at 113.3880 on the 15 Minutes BRN/USD chart. BRN/USD is likely to test this level soon.

The last 3 1 hour candles on NGC/USD have formed a Triangle pattern and broken out through the pattern lines, indicating a possible bullish movement toward the price level at 2.6716.

EURUSD is approaching a critical level that could be a key deciding factor for what comes next. We may see this trajectory continue to test and break through 1.1791, unless it loses momentum and pulls back to current levels.

XAUUSD is moving toward a resistance line. Since it has retraced from this line before, we may see either a breakout through this line or a rebound to current levels. It has touched this line numerous times in the last 19 hours and may test it again within the next 6 hours.

LTCUSD is approaching a support line at 54.8600. If it hits the support line, it may break through this level to continue the bearish trend, or it may return to current levels.

FTSE100 has broken through the resistance line of a Falling Wedge technical chart pattern. Because it has retraced from this line in the past, you should wait for confirmation of the breakout before taking any action. It has touched this line twice in the last 21 days, which suggests a possible target around 10543.0275 within […]