Autochartist General
MARKET ANALYSIS

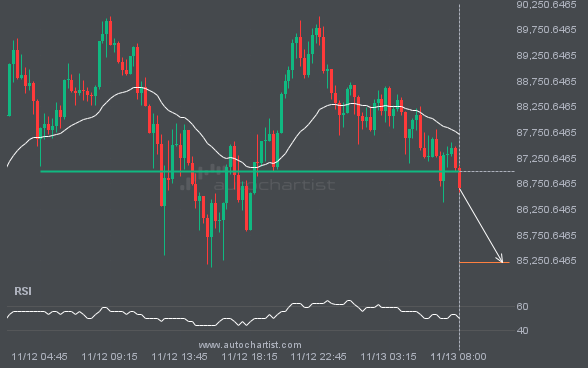
BTCUSD has broken through a line of 86996.5234. If this breakout holds true, we could see the price of BTCUSD heading towards 85222.7344 within the next 6 hours. But don’t be so quick to trade, it has tested this line numerous times in the past, so you should probably confirmation the breakout before placing any trades.
Emerging Falling Wedge pattern in its final wave was identified on the S&P500 15 Minutes chart. After a strong bearish

A Falling Wedge pattern was identified on XAGUSD at 30.199, creating an expectation that it may move to the support

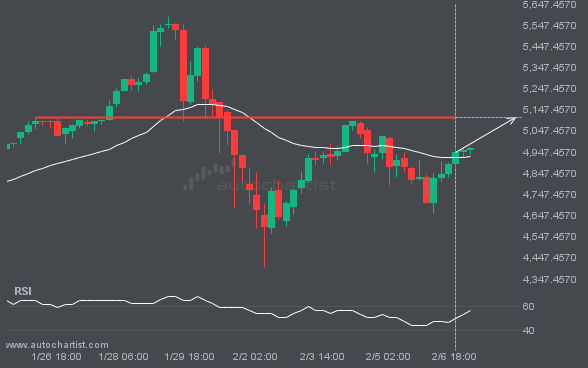
GBPJPY is moving towards a resistance line. Because we have seen it retrace from this line before, we could see

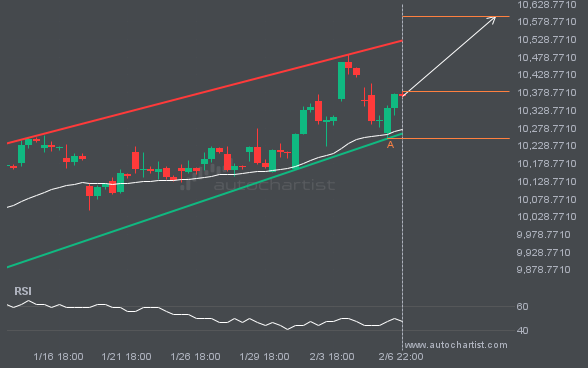
An emerging Rising Wedge has been detected on NGC/USD on the 15 Minutes chart. There is a possible move towards

Emerging Rising Wedge pattern in its final wave was identified on the ETHUSD 30 Minutes chart. After a strong bullish

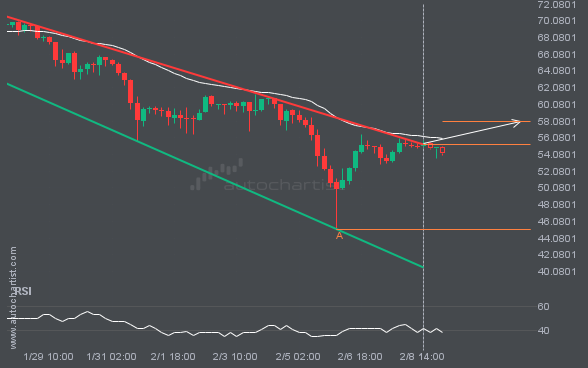
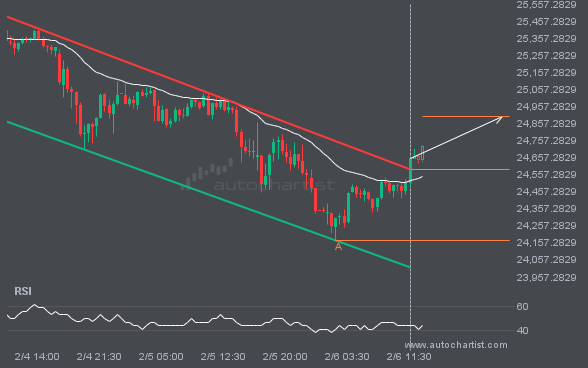
Emerging Channel Down pattern in its final wave was identified on the EURUSD 4 hour chart. After a strong bearish

NAS100 is en route to a very important line that will be a definite deciding factor of what is to