MARKET ANALYSIS

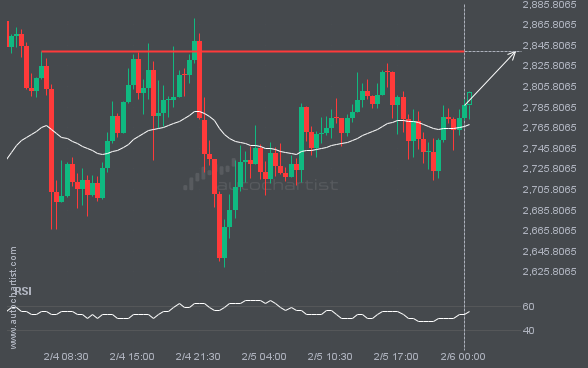
The movement of ETHUSD towards 2839.3401 price line is yet another test of the line it reached numerous times in the past. We could expect this test to happen in the next 9 hours, but it is uncertain whether it will result in a breakout through this line, or simply rebound back to current lines.
A movement of 4.98% over 2 days on BTCUSD doesn’t go unnoticed. You may start considering where it’s heading next, a continuation of the current downward trend, or a reversal in the previous direction.

USDJPY is moving towards a line of 156.1170 which it has tested numerous times in the past. We have seen it retrace from this position in the past, so at this stage it isn’t clear whether it will breach this price or rebound as it did before. If USDJPY continues in its current trajectory, we […]

The last 8 4 hour candles on S&P500 formed a Pennant pattern and broken out through the pattern lines, indicating a possible bearish movement towards the price level of 5971.3683.

Rising Wedge pattern identified on XAUUSD has broken through a support level with the price momentum continuing to move in an downward direction. A solid trading opportunity continues with the price expected to reach 2792.5989 in the next 20.

A strong resistance level has been breached at 21638.8027 on the 30 Minutes NAS100 chart. Technical Analysis theory forecasts a movement to 22059.1699 in the next 2 days.

This trade setup on GBPJPY is formed by a period of consolidation; a period in which the price primarily moves sideways before choosing a new direction for the longer term. Because of the bullish breakout through resistance, it seems to suggest that we could see the next price move to 192.5952.