MARKET ANALYSIS

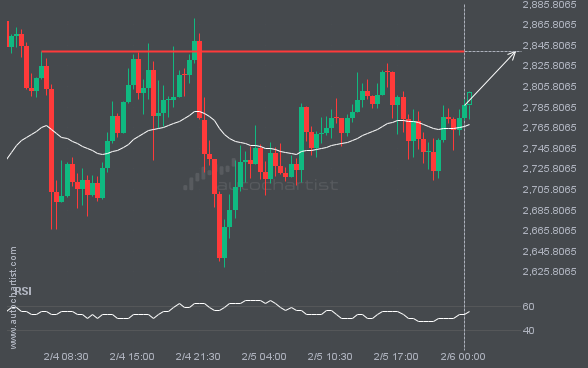
The movement of ETHUSD towards 2839.3401 price line is yet another test of the line it reached numerous times in the past. We could expect this test to happen in the next 9 hours, but it is uncertain whether it will result in a breakout through this line, or simply rebound back to current lines.
LTCUSD has broken through a support line. Because we have seen it retrace from this price in the past, one should wait for confirmation of the breakout before trading. It has touched this line numerous times in the last 2 days and suggests a possible target level to be around 96.9730 within the next 6 […]

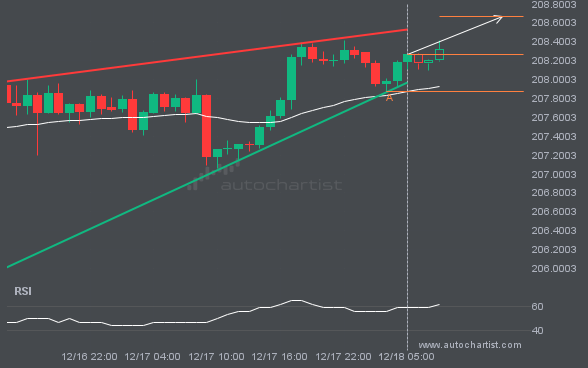
USDJPY is heading towards the resistance line of a Ascending Triangle. If this movement continues, the price of USDJPY could test 155.8294 within the next 2 days. It has tested this line numerous times in the past, so this movement could be short-lived and end up rebounding just like it did in the past.

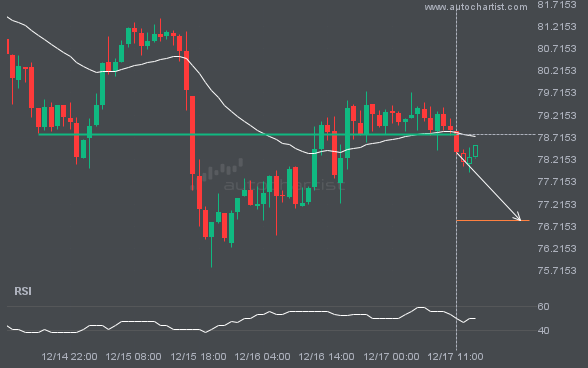
BRN/USD is once again retesting a key horizontal support level at 76.0120. It has tested this level 4 times in the recent past and could simply bounce off like it did last time. However, after this many tries, maybe it’s ready to start a new trend.

An emerging Rectangle has been detected on S&P500 on the 4 hour chart. There is a possible move towards 6119.4550 next few candles. Once reaching support it may continue its bullish run or reverse back to current price levels.

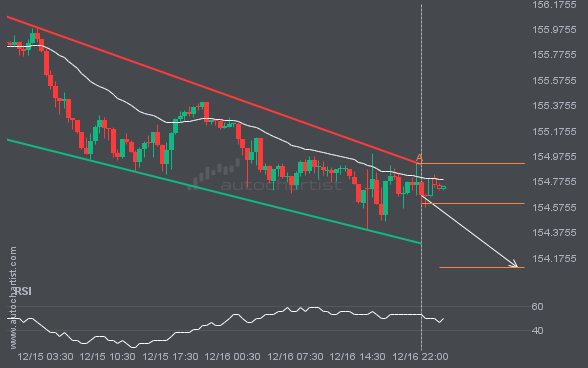
GBPJPY is approaching the support line of a Falling Wedge. It has touched this line numerous times in the last 4 days. If it tests this line again, it should do so in the next 9 hours.

NAS100 has moved lower by 3.96% from 21793.6081 to 20929.8791 in the last 3 days.

A movement of 1.91% over 3 days on EURUSD doesn’t go unnoticed. You may start considering where it’s heading next, a continuation of the current downward trend, or a reversal in the previous direction.