MARKET ANALYSIS

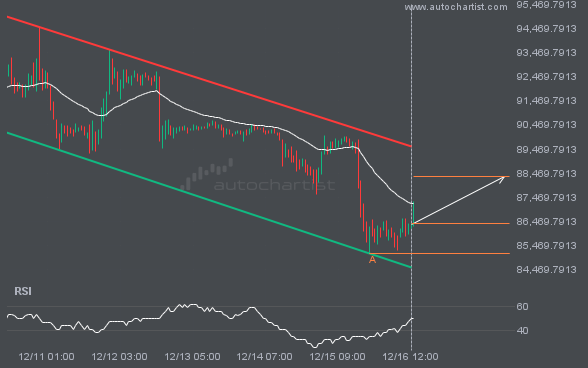
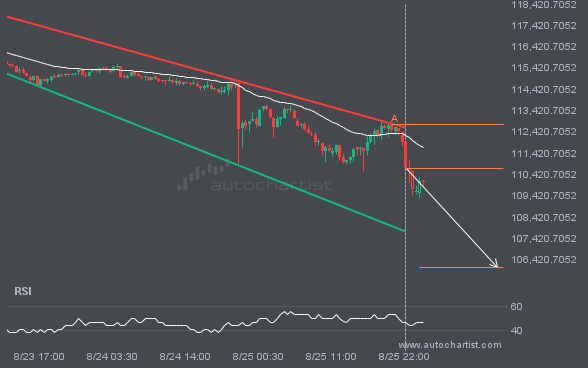
BTCUSD is trapped in a Channel Down formation, implying that a breakout is Imminent. This is a great trade-setup for both trend and swing traders. It is now approaching a resistance line that has been tested in the past. Divergence opportunists may be very optimistic about a possible breakout and this may be the start of a new trend. It may also be that this convergence factor may result in the ideal setup for swing traders that are on the lookout for a possible bounce-back. Whatever happens, an initial move towards 106060.2568 is expected in the short term.
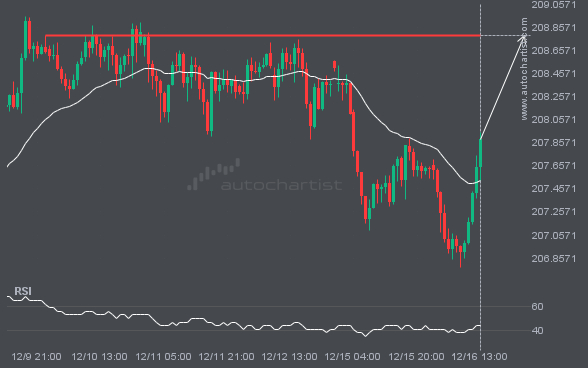
The price of S&P500 in heading back to the resistance area. It is possible that it will struggle to break through it and move back in the other direction. The price may eventually break through, but typically the price retreats from the level a number of times before doing so.

The movement of NGC/USD towards 2.7325 price line is yet another test of the line it reached numerous times in the past. We could expect this test to happen in the next 9 hours, but it is uncertain whether it will result in a breakout through this line, or simply rebound back to current lines.

A strong resistance level has been identified at 115925.5391 on the 30 Minutes BTCUSD chart. BTCUSD is likely to test it soon.

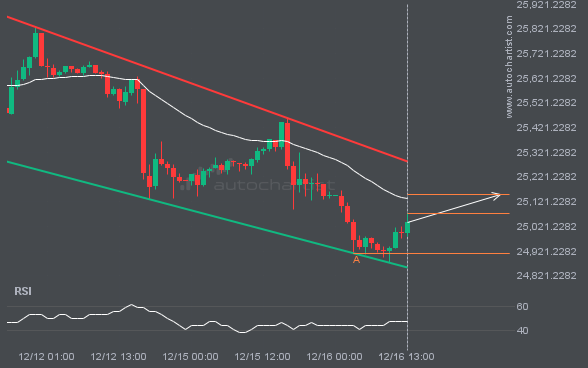
An emerging Channel Down has been detected on USDJPY on the 4 hour chart. There is a possible move towards 145.5789 next few candles. Once reaching resistance it may continue its bearish run or reverse back to current price levels.

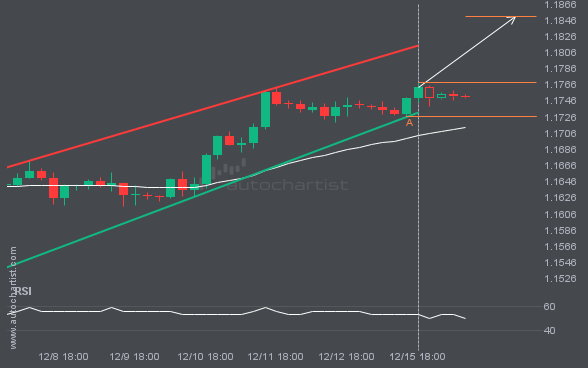
EURUSD is en route to a very important line that will be a definite deciding factor of what is to come! We may see this trajectory continue to touch and break through 1.1693, unless it runs out of momentum and pulls back to current levels.

This trade setup on LTCUSD is formed by a period of consolidation; a period in which the price primarily moves sideways before choosing a new direction for the longer term. Because of the bullish breakout through resistance, it seems to suggest that we could see the next price move to 117.7329.

BRN/USD is approaching the resistance line of a Triangle. It has touched this line numerous times in the last 11 days. If it tests this line again, it should do so in the next 2 days.