MARKET ANALYSIS

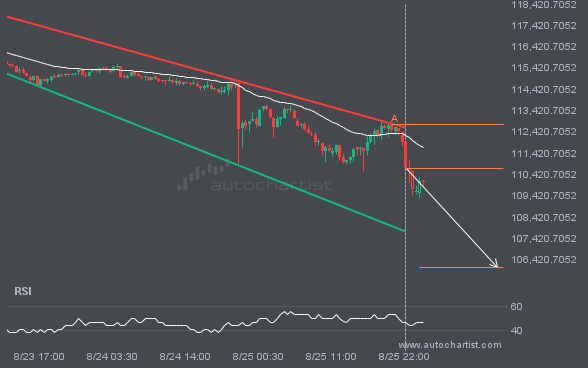
BTCUSD is trapped in a Channel Down formation, implying that a breakout is Imminent. This is a great trade-setup for both trend and swing traders. It is now approaching a resistance line that has been tested in the past. Divergence opportunists may be very optimistic about a possible breakout and this may be the start of a new trend. It may also be that this convergence factor may result in the ideal setup for swing traders that are on the lookout for a possible bounce-back. Whatever happens, an initial move towards 106060.2568 is expected in the short term.
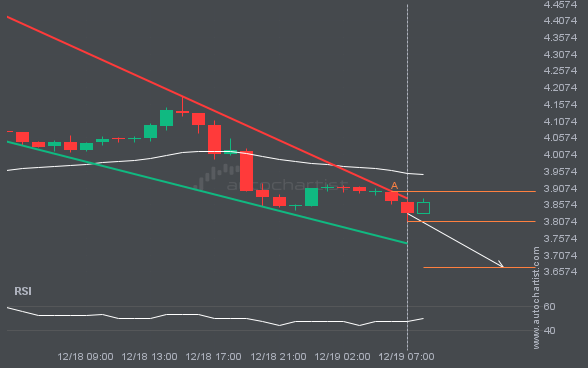
BRN/USD is moving towards a support line. Because we have seen it retrace from this line before, we could see either a break through this line, or a rebound back to current levels. It has touched this line numerous times in the last 3 days and may test it again within the next 5 hours.

ETHUSD is moving towards a support line. Because we have seen it retrace from this level in the past, we could see either a break through this line, or a rebound back to current levels. It has touched this line numerous times in the last 3 days and may test it again within the next […]

NAS100 posted 5 consecutive candles over the last 20 hours — an unusually large movement.

GBPJPY is moving towards a support line. Because we have seen it retrace from this line before, we could see either a break through this line, or a rebound back to current levels. It has touched this line numerous times in the last 10 days and may test it again within the next 3 days.

LTCUSD is approaching a support line at 115.4200. If it hits the support line, it may break through this level to continue the bearish trend, or it may turn around back to current levels.

NGC/USD is heading towards a line of 2.7230. If this movement continues, the price of NGC/USD could test 2.7230 within the next 14 hours. But don’t be so quick to trade, it has tested this line numerous times in the past, so this movement could be short-lived and end up rebounding.

S&P500 is approaching a resistance line at 6411.0698. If it hits the resistance line, it may break through this level to continue the bullish trend, or it may turn around back to current levels.