Skip to content
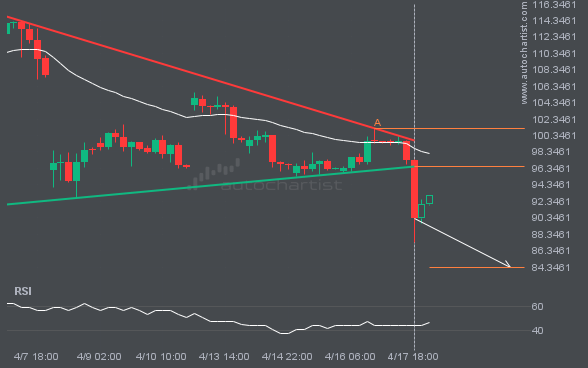
 BRN/USD has broken through the support line of a Triangle technical chart pattern. Because it has retraced from this line in the past, you should wait for confirmation of the breakout before taking any action. It has touched this line twice in the last 17 days, suggesting a possible target level around 84.2973 within the next 3 days.