 Skip to content
 A rare candlestick sequence was recorded on the ETHUSD Daily chart, ending at 2346.6900.
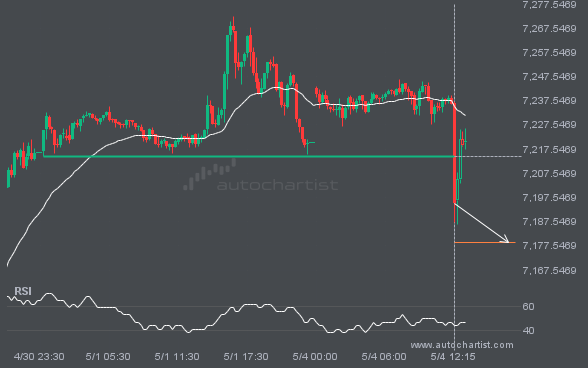
S&P500 has broken through a line at 7214.6802. If this breakout holds, we could see the price of S&P500 move toward 7178.7388 within the next 7 hours. However, don’t be too quick to trade. It has tested this line many times in the past, so confirm the breakout before placing any trades.
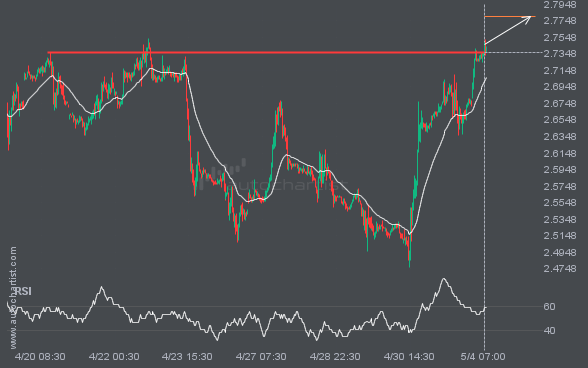
NGC/USD has broken through a line at 2.7365. If this breakout holds, we could see the price of NGC/USD move toward 2.7796 within the next 3 days. However, don’t be too quick to trade. It has tested this line many times in the past, so confirm the breakout before placing any trades.
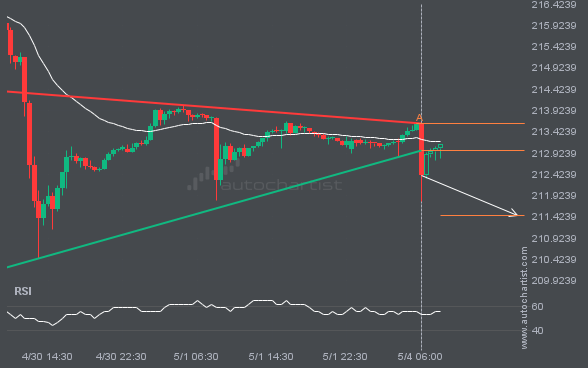
Triangle pattern identified on GBPJPY has broken through a support level, with price momentum continuing to move downward. This presents a solid trading opportunity, with the price expected to reach 211.4635 in the next 11.
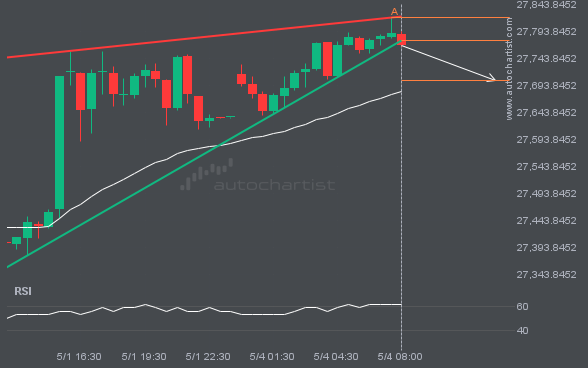
This trade setup on NAS100 formed after a period of consolidation, during which the price moved mostly sideways before choosing a longer-term direction. Following the bearish breakout through support, the price could move toward 27703.0311.
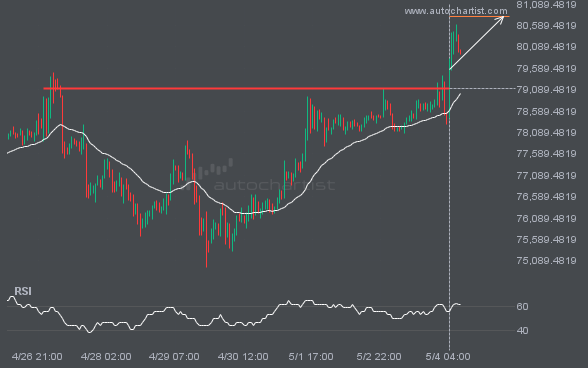
BTCUSD has breached the resistance line at 79117.3828. It may continue the bullish trend toward 80796.3984, or it may be yet another test of this level.
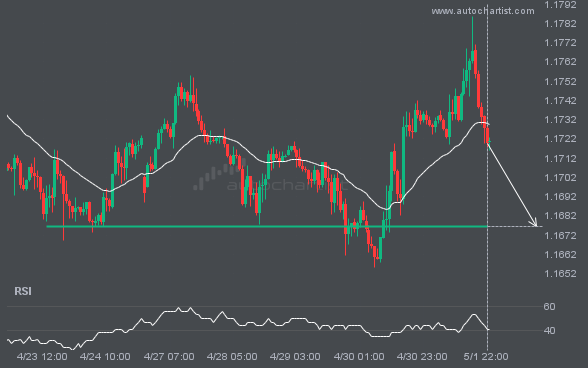
EURUSD is moving toward a level at 1.1676, which it has tested many times before. We have seen it retrace from this level before, so at this stage it isn’t clear whether it will break through this price or rebound again. If EURUSD continues on its current trajectory, we may see it move toward 1.1676 […]
Autochartist provides an extensive analytics toolset with features to take your trading to the next level. Empower your day-to-day trading decisions with an unrivalled breadth and depth of analysis driven by advanced algorithms, powerful big-data technology, and user-friendly trading tools.

