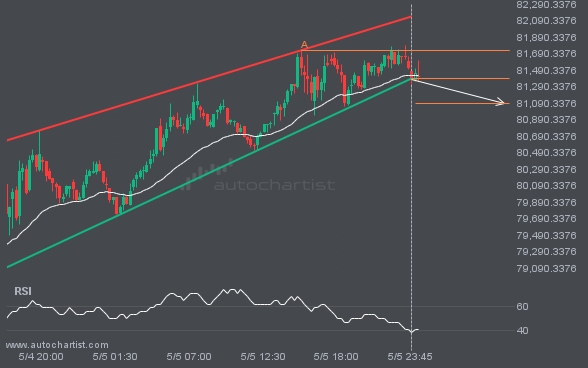
It would be prudent to confirm the breakout that just occurred. Do you consider the move through support significant? Do you have indicators confirming that the price momentum will continue? If so, aim for a target of 81085.7771, but consider reducing your position size as the price approaches that target.
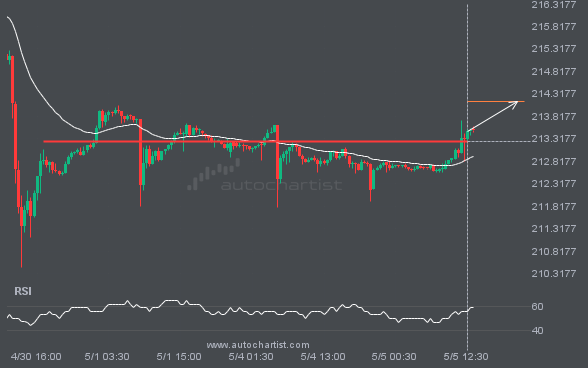
A strong resistance level has been breached at 213.2650 on the 30 Minutes GBPJPY chart. Technical analysis forecasts a move to 214.1400 within the next 16 hours.
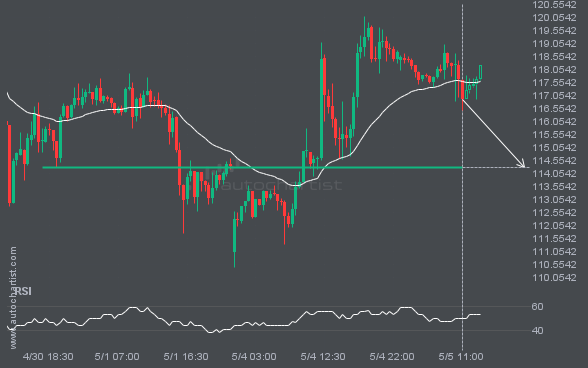
BRN/USD is approaching the line at 114.2960. If this move continues, the price of BRN/USD could test 114.2960 within the next 12 hours. But do not rush to trade. It has tested this line many times in the past, so the move could be short-lived and end in a rebound.
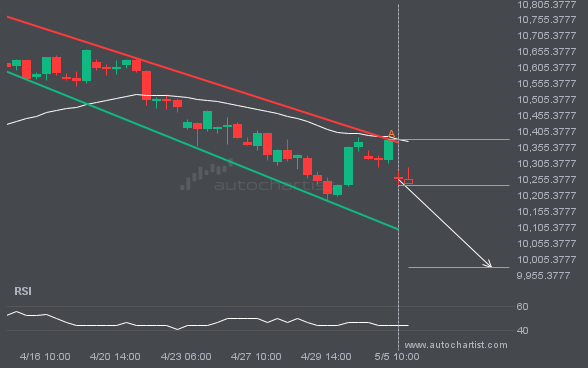
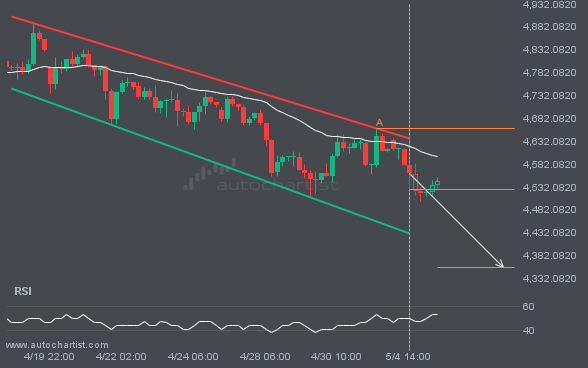
FTSE100 was identified around 10236.7 after recently rebounding off the resistance on the 4 hour interval. Ultimately, the stock’s price action has formed a Channel Down pattern. This squeeze may increase the chances of a strong breakout. The projected move could take the price to around 9981.8896.
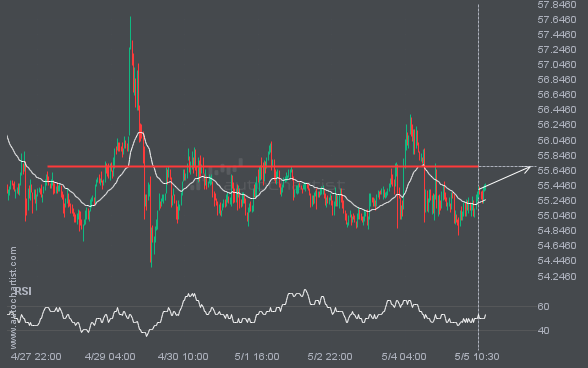
LTCUSD is moving toward a resistance line. Because it has retraced from this level in the past, we may see either a breakout through this line or a rebound to current levels. It has touched this line multiple times over the last 8 days and may test it again within the next 2 days.
XAUUSD is moving toward a support line. Since it has retraced from this line before, we may see either a breakout through it or a rebound to current levels. It has touched this line multiple times in the past 18 days and may test it again within the next 3 days.
Enjoy Access to Premium Autochartist
Trading Tools - Sign Up and Explore for Free Now!
Autochartist provides an extensive analytics toolset with features to take your trading to the next level. Empower your day-to-day trading decisions with an unrivalled breadth and depth of analysis driven by advanced algorithms, powerful big-data technology, and user-friendly trading tools.