 Skip to content
 BRN/USD is trapped in a Rising Wedge formation, implying that a breakout is imminent. This is a strong trade setup
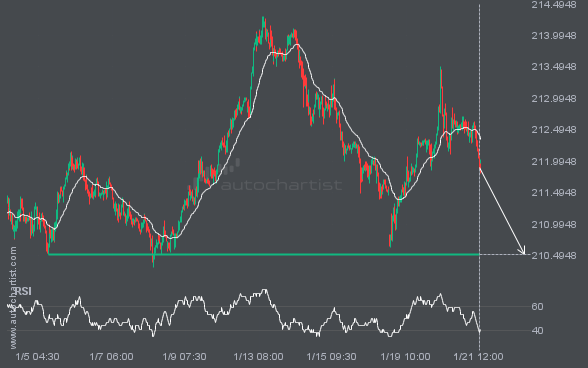
GBPJPY is moving toward a key support level at 210.5175. GBPJPY has tested this level 5 times before, and on each occasion it has bounced off. Could this be the time it finally breaks through?
The price of LTCUSD is heading back toward the resistance area. It may struggle to break through and could reverse direction. The price may eventually break through, but it typically retreats from the level several times before doing so.
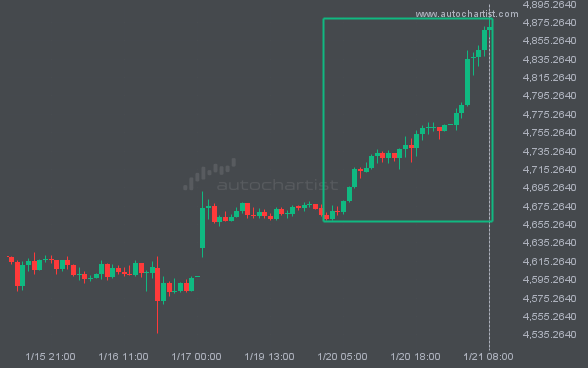
XAUUSD reached 4869.995 after a 4.49% move spanning 2 days.
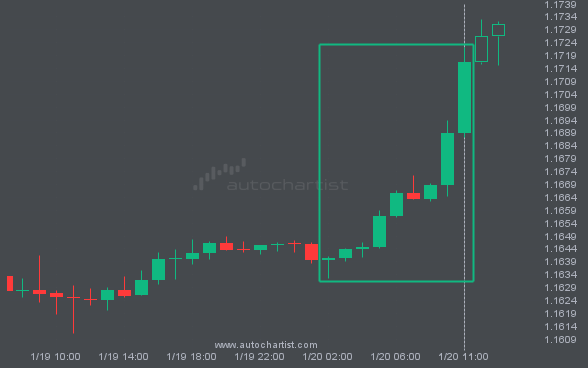
An unexpectedly large move occurred on the EURUSD 1 hour chart, starting at 1.164035 and reaching 1.17162. It stands out in recent trading activity.
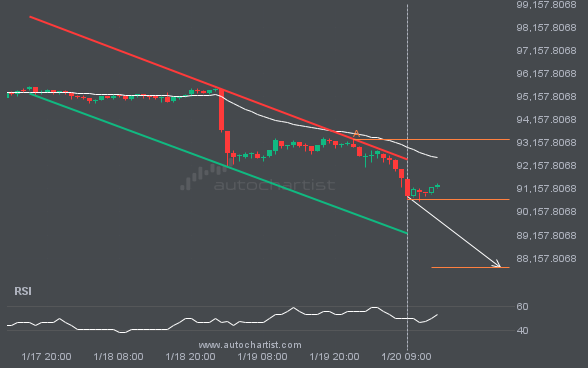
An emerging Channel Down has been detected on BTCUSD. The pattern has not yet broken through resistance, but the price is expected to move up over the next few hours. At the time the pattern was found, the price was 90698.47, and it is expected to move to 87756.7250.
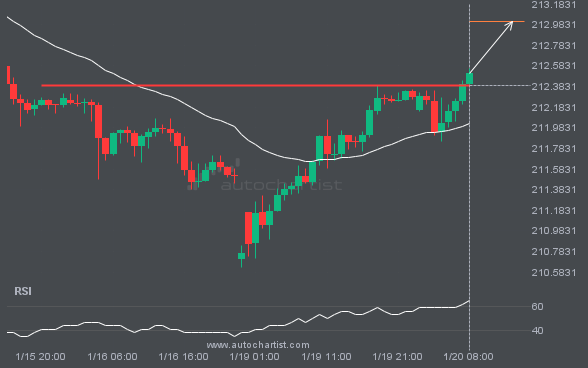
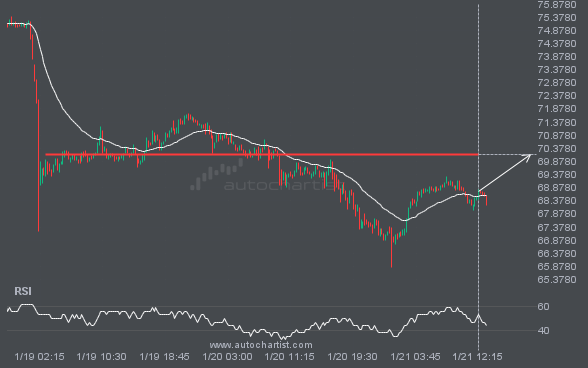
A strong resistance level has been breached at 212.3925 on the 1 hour GBPJPY chart. Technical analysis forecasts a move to 213.0119 within the next 14 hours.
Autochartist provides an extensive analytics toolset with features to take your trading to the next level. Empower your day-to-day trading decisions with an unrivalled breadth and depth of analysis driven by advanced algorithms, powerful big-data technology, and user-friendly trading tools.

