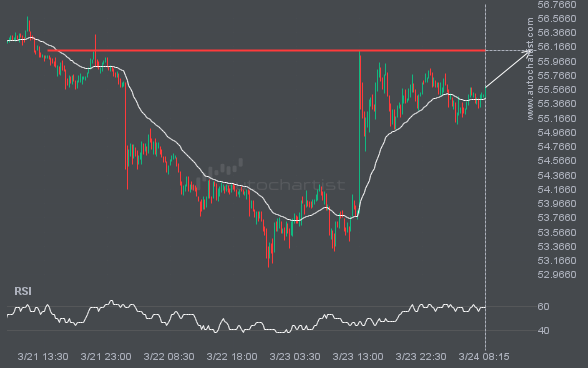
LTCUSD is approaching the line at 56.1200. If this move continues, the price of LTCUSD could test 56.1200 within the next 16 hours. But do not rush to trade. It has tested this line many times in the past, so the move could be short-lived and end in a rebound.
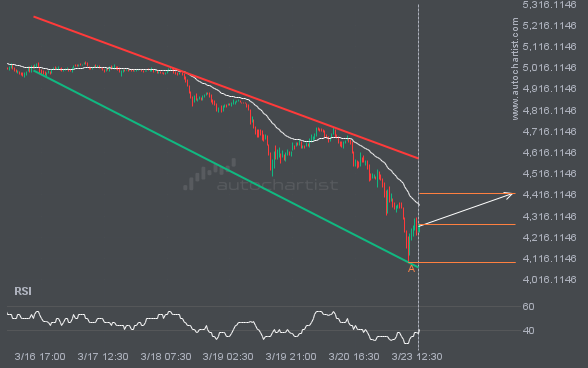
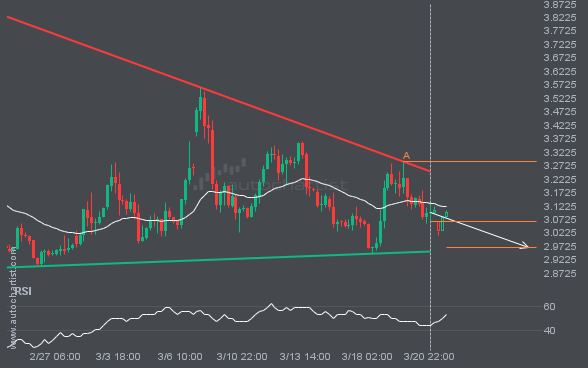
XAUUSD is heading toward the resistance line of a Channel Down pattern and could reach it within the next 2 days. It has tested this line numerous times before, and this time may be no different, ending in a rebound instead of a breakout. If a breakout doesn’t occur, we could see a retracement back […]
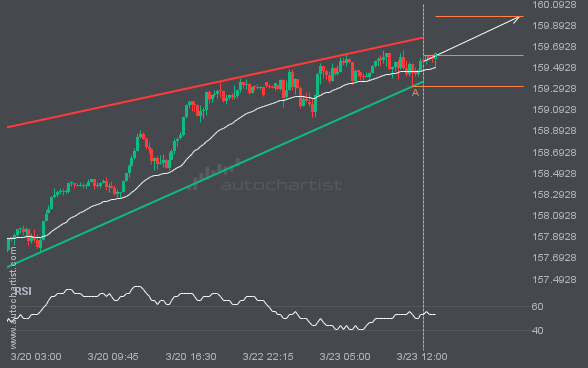
USDJPY was identified around 159.6035 after recently rebounding off the support on the 15 Minutes interval. Ultimately, the stock’s price action has formed a Rising Wedge pattern. This squeeze may increase the chances of a strong breakout. The projected move could take the price to around 159.9742.
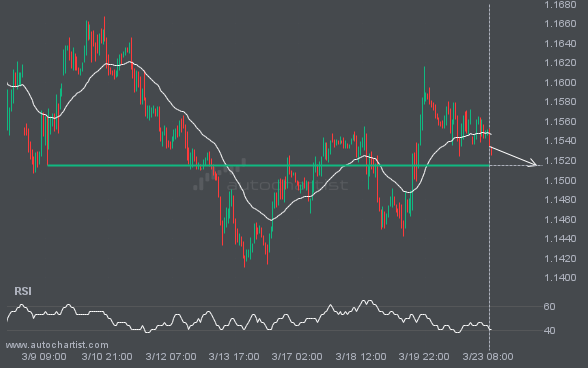
The movement of EURUSD towards the 1.1515 price line is yet another test of a line it has reached numerous times in the past. We can expect this test to occur within the next 3 days, but it is uncertain whether it will result in a breakout through this line or simply rebound to current […]
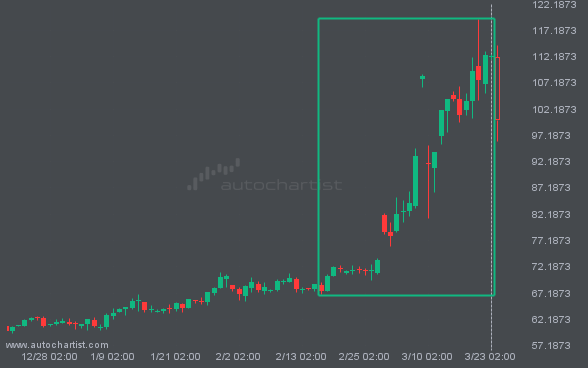
NGC/USD is moving toward a support line. Since it has retraced from this line before, we may see either a breakout through this line or a rebound to current levels. It has touched this line numerous times in the last 50 days and may test it again within the next 3 days.
Enjoy Access to Premium Autochartist
Trading Tools - Sign Up and Explore for Free Now!
Autochartist provides an extensive analytics toolset with features to take your trading to the next level. Empower your day-to-day trading decisions with an unrivalled breadth and depth of analysis driven by advanced algorithms, powerful big-data technology, and user-friendly trading tools.