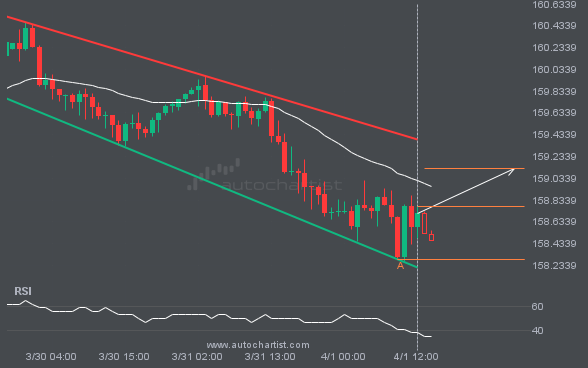
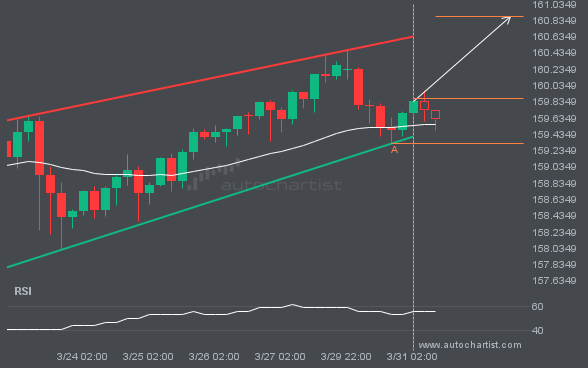
An emerging Channel Down pattern in its final wave has been identified on the USDJPY 1 hour chart. After a strong bullish run, USDJPY is heading toward the upper triangle trendline, with possible resistance at 159.1271. If the resistance holds, the Channel Down pattern suggests a rebound toward current levels.
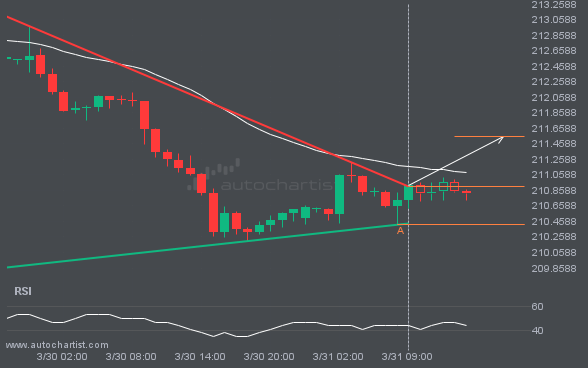
A breakout of GBPJPY through the resistance line of a Triangle could signal what’s ahead. If the breakout persists, we may see GBPJPY’s price test 211.5479 within the next 5 hours.
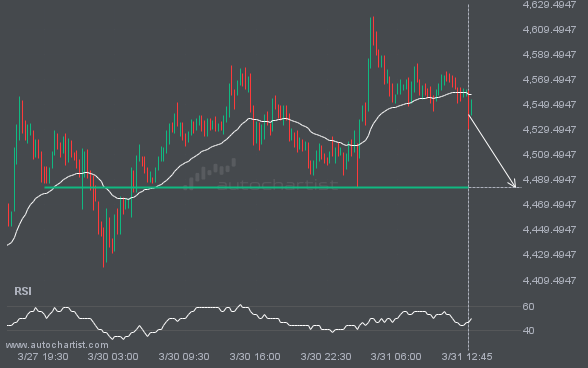
XAUUSD is about to retest a key horizontal support level near 4482.8999. It has tested this level 3 times recently and may simply bounce off it, as it did last time. However, after so many attempts, it may be ready to start a new trend.
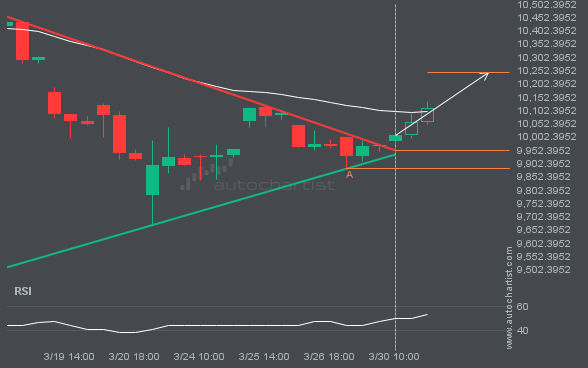
The last 20 4 hour candles on FTSE100 have formed a Triangle pattern and broken out through the pattern lines, indicating a possible bullish movement toward the price level at 10243.9850.
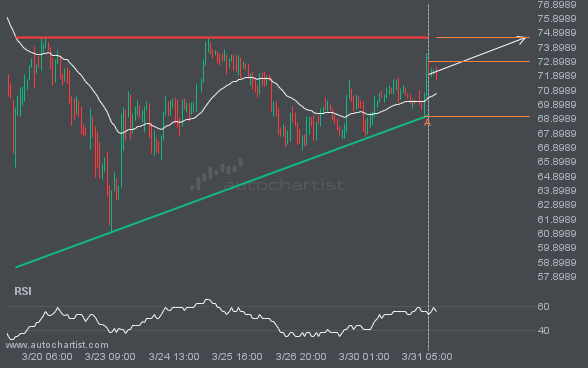
An emerging Ascending Triangle pattern in its final wave has been identified on the XAGUSD 1 hour chart. After a strong bullish run, XAGUSD is heading toward the upper triangle trendline, with possible resistance at 74.5846. If the resistance holds, the Ascending Triangle pattern suggests a rebound toward current levels.
USDJPY is moving toward a resistance line. Since it has retraced from this line before, we may see either a breakout through it or a rebound to current levels. It has touched this line multiple times in the past 12 days and may test it again within the next 2 days.
Enjoy Access to Premium Autochartist
Trading Tools - Sign Up and Explore for Free Now!
Autochartist provides an extensive analytics toolset with features to take your trading to the next level. Empower your day-to-day trading decisions with an unrivalled breadth and depth of analysis driven by advanced algorithms, powerful big-data technology, and user-friendly trading tools.