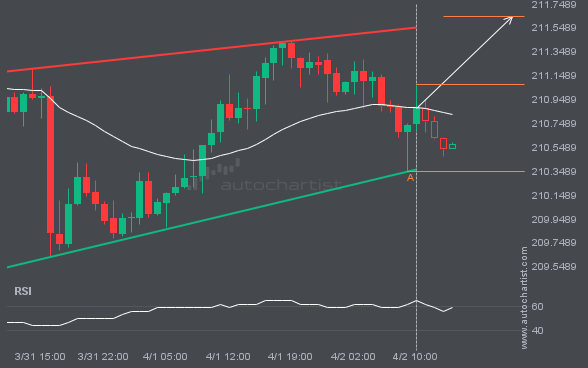
The movement of GBPJPY toward the resistance line of a Rising Wedge is yet another test of the line it has reached numerous times in the past. This test of the line could occur within the next 10 hours, but it is uncertain whether it will result in a breakout through this line or simply […]
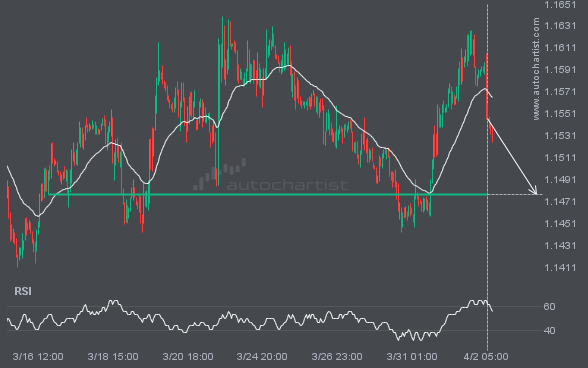
EURUSD is approaching a support line at 1.1478. If it hits the support line, it may break through this level to continue the bearish trend, or it may return to current levels.
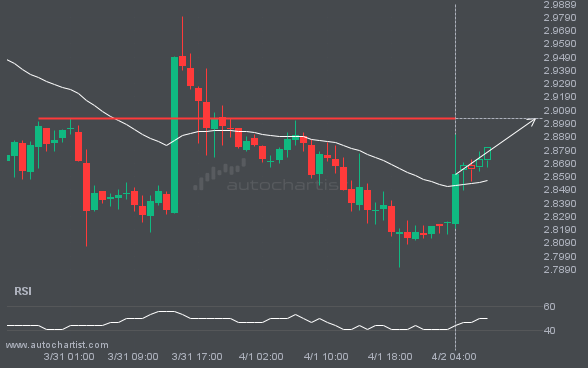
NGC/USD is approaching the line at 2.9025. If this move continues, the price of NGC/USD could test 2.9025 within the next 8 hours. But do not rush to trade. It has tested this line many times in the past, so the move could be short-lived and end in a rebound.
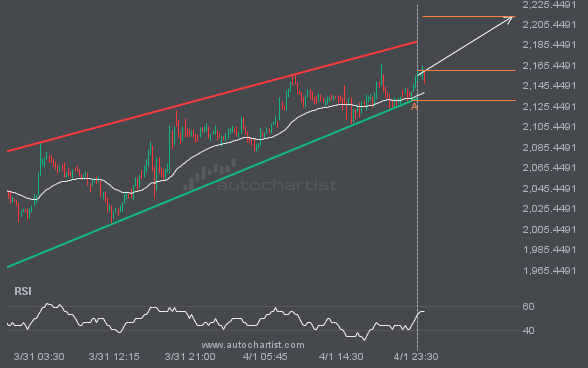
ETHUSD is moving toward a resistance line. Since it has retraced from this line before, we may see either a breakout through it or a rebound to current levels. It has touched this line multiple times in the past 3 days and may test it again within the next 13 hours.
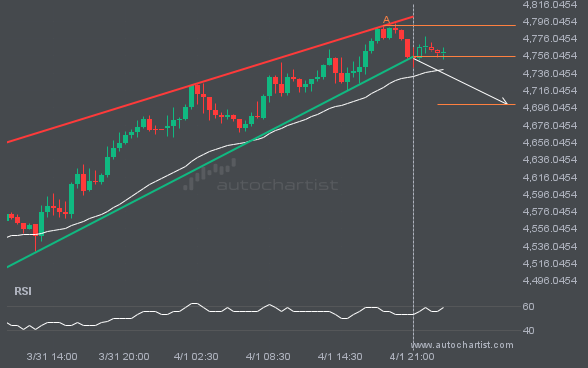
XAUUSD has broken through the support line of a Rising Wedge technical chart pattern. Because it has retraced from this line in the past, you should wait for confirmation of the breakout before taking any action. It has touched this line twice in the last 2 days, suggesting a possible target level around 4700.4356 within […]
XAGUSD is moving toward a support line. Since it has retraced from this line before, we may see either a breakout through it or a rebound to current levels. It has touched this line multiple times in the past 13 days and may test it again within the next 3 days.
Enjoy Access to Premium Autochartist
Trading Tools - Sign Up and Explore for Free Now!
Autochartist provides an extensive analytics toolset with features to take your trading to the next level. Empower your day-to-day trading decisions with an unrivalled breadth and depth of analysis driven by advanced algorithms, powerful big-data technology, and user-friendly trading tools.