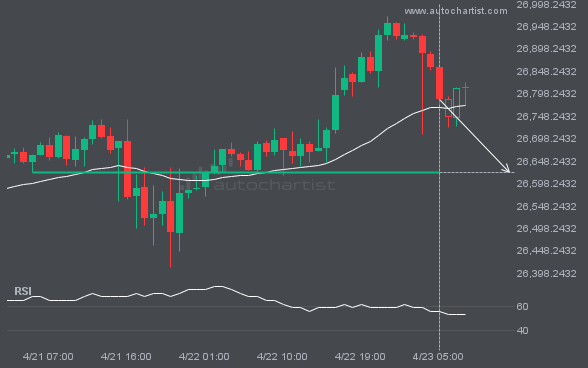
NAS100 is moving toward a key support level at 26623.2422. This level has been tested before for NAS100. This may present a good trading opportunity either at the spot price or after a breakout through this level.
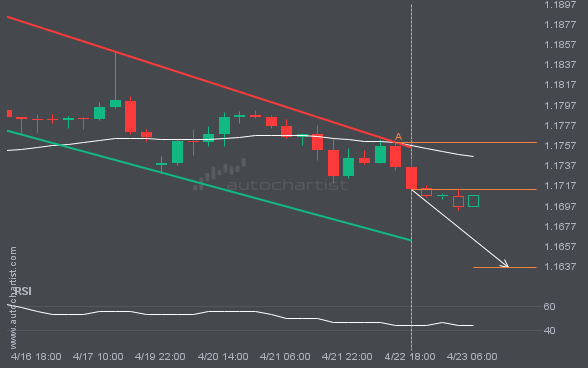
EURUSD is moving toward a support line. Since it has retraced from this line before, we may see either a breakout through it or a rebound to current levels. It has touched this line multiple times in the past 7 days and may test it again within the next 15 hours.
BTCUSD is moving toward a support line. Since it has retraced from this line before, we may see either a breakout through it or a rebound to current levels. It has touched this line multiple times in the past 8 days and may test it again within the next 3 days.
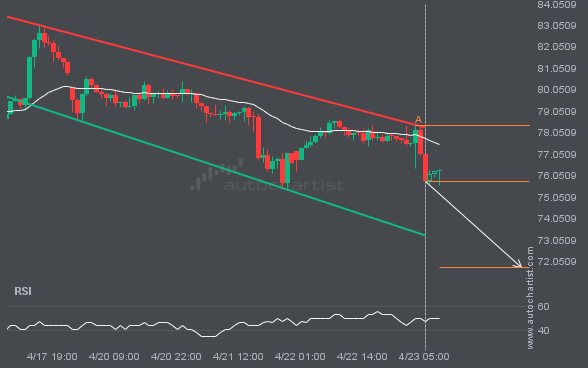
An emerging Channel Down has been detected on XAGUSD. The pattern has not yet broken through resistance, but the price is expected to move up over the next few hours. At the time the pattern was found, the price was 75.785, and it is expected to move to 71.7967.
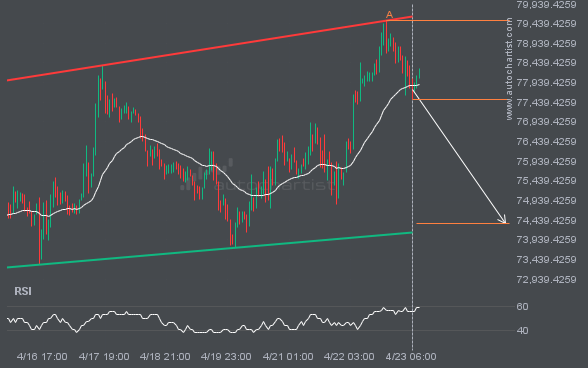
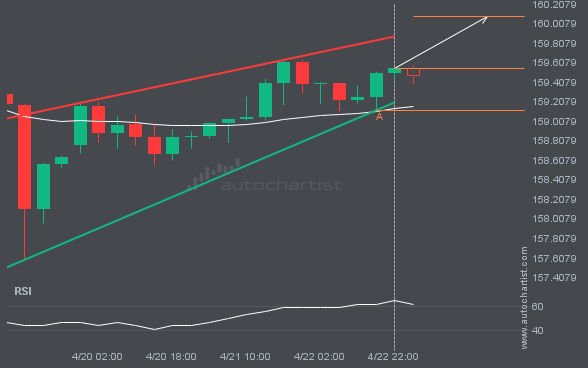
USDJPY was identified around 159.5515 after recently rebounding off the support on the 4 hour interval. Ultimately, the stock’s price action has formed a Rising Wedge pattern. This squeeze may increase the chances of a strong breakout. The projected move could take the price to around 160.0795.
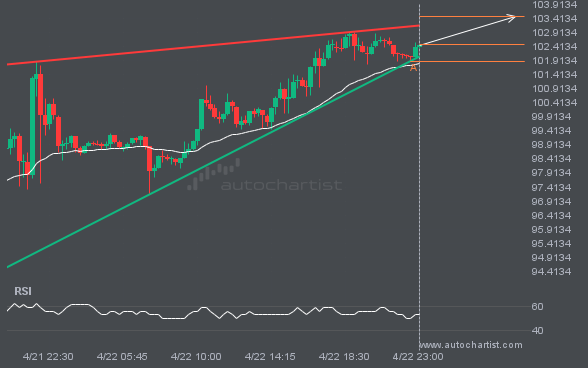
BRN/USD is heading toward the resistance line in a Rising Wedge pattern. If this move continues, the price of BRN/USD could test 103.4679 within the next 7 hours. It has tested this line many times before, so the move could be short-lived and may rebound as it has before.
Enjoy Access to Premium Autochartist
Trading Tools - Sign Up and Explore for Free Now!
Autochartist provides an extensive analytics toolset with features to take your trading to the next level. Empower your day-to-day trading decisions with an unrivalled breadth and depth of analysis driven by advanced algorithms, powerful big-data technology, and user-friendly trading tools.