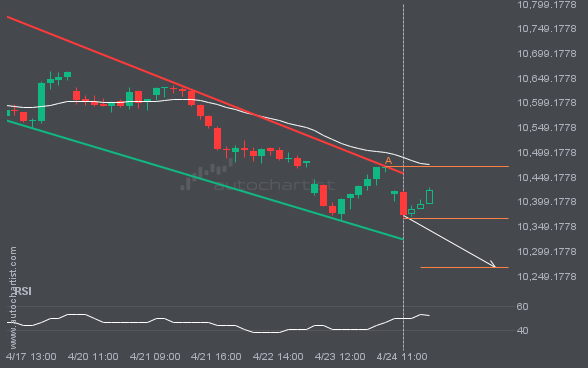
FTSE100 is moving toward a support line it has tested many times. It has retraced from this line before, so it’s unclear whether it will break through or rebound again. If FTSE100 continues on its current trajectory, it could reach 10266.8450 within the next 10 hours.
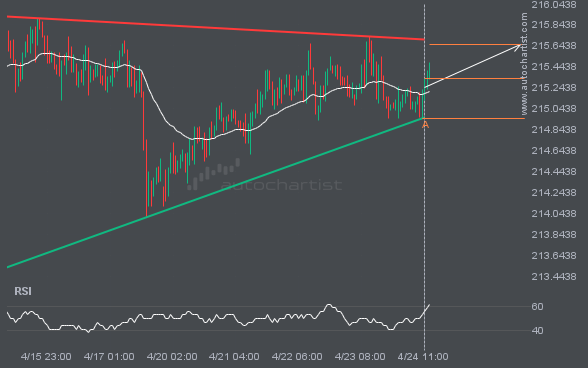
GBPJPY is heading toward the resistance line in a Triangle pattern. If this move continues, the price of GBPJPY could test 215.6588 within the next 3 days. It has tested this line many times before, so the move could be short-lived and may rebound as it has before.
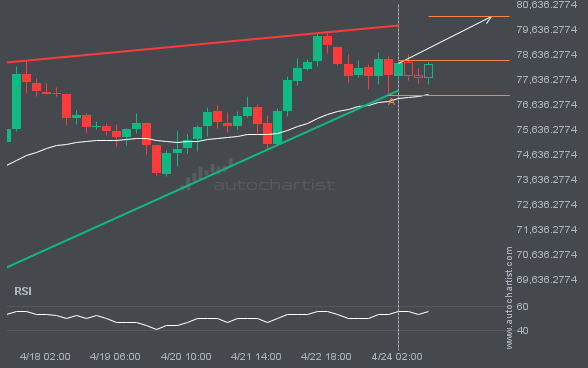
An emerging Rising Wedge pattern in its final wave has been identified on the BTCUSD 4 hour chart. After a strong bullish run, BTCUSD is heading toward the upper triangle trendline, with possible resistance at 80134.8675. If the resistance holds, the Rising Wedge pattern suggests a rebound toward current levels.
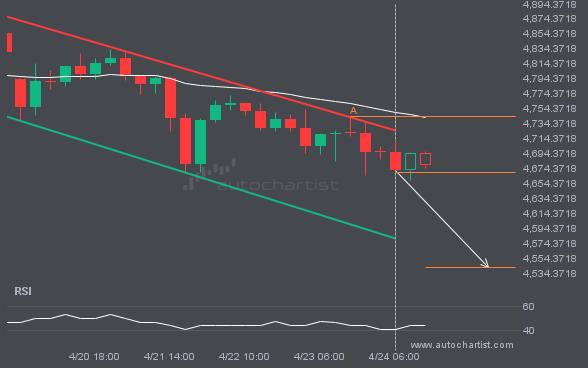
The movement of XAUUSD toward the support line of a Channel Down is yet another test of the line it has reached numerous times in the past. This test of the line could occur within the next 22 hours, but it is uncertain whether it will result in a breakout through this line or simply […]
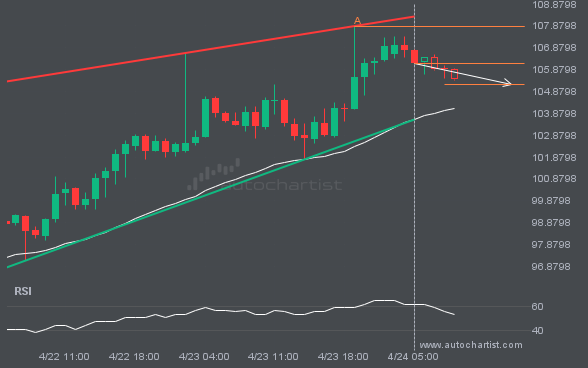
BRN/USD was identified around 106.163 after recently rebounding off the resistance on the 1 hour interval. Ultimately, the stock’s price action has formed a Rising Wedge pattern. This squeeze may increase the chances of a strong breakout. The projected move could take the price to around 105.1965.
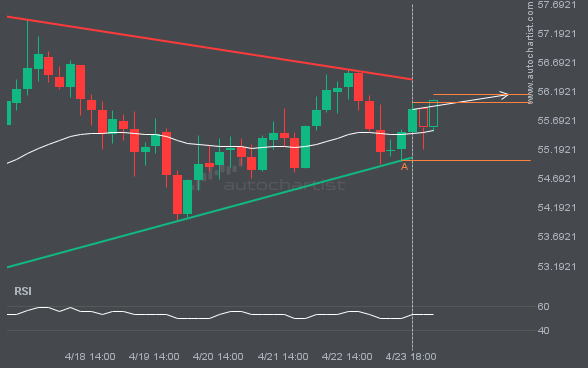
A Triangle pattern was identified for LTCUSD at 56.0, suggesting it may move toward the resistance line at 56.1450. It may break through that line and continue the bullish trend, or reverse from it.
Enjoy Access to Premium Autochartist
Trading Tools - Sign Up and Explore for Free Now!
Autochartist provides an extensive analytics toolset with features to take your trading to the next level. Empower your day-to-day trading decisions with an unrivalled breadth and depth of analysis driven by advanced algorithms, powerful big-data technology, and user-friendly trading tools.