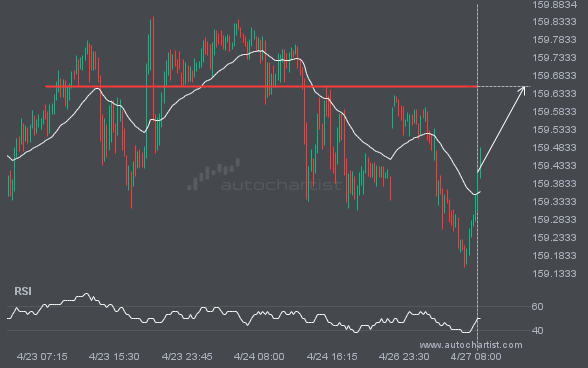
USDJPY is moving toward a resistance line. Because it has retraced from this level in the past, we may see either a breakout through this line or a rebound to current levels. It has touched this line multiple times over the last 5 days and may test it again within the next 12 hours.
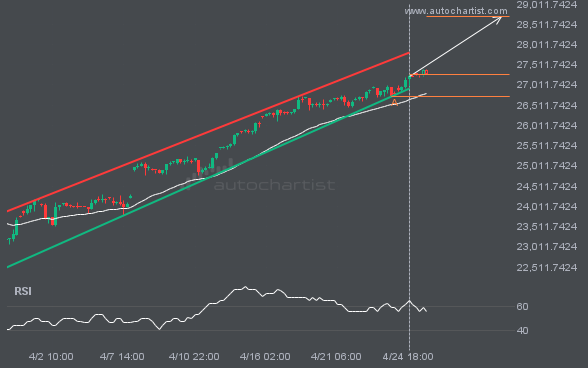
An emerging Channel Up pattern in its final wave has been identified on the NAS100 4 hour chart. After a strong bullish run, NAS100 is heading toward the upper triangle trendline, with possible resistance at 28701.8878. If the resistance holds, the Channel Up pattern suggests a rebound toward current levels.
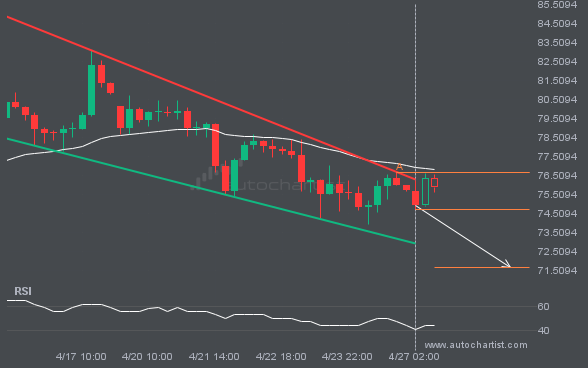
An emerging Falling Wedge pattern in its final wave has been identified on the XAGUSD 4 hour chart. After a strong bearish run, XAGUSD is heading toward the upper triangle trendline, with possible resistance at 71.6759. If the support holds, the Falling Wedge pattern suggests a rebound toward current levels.
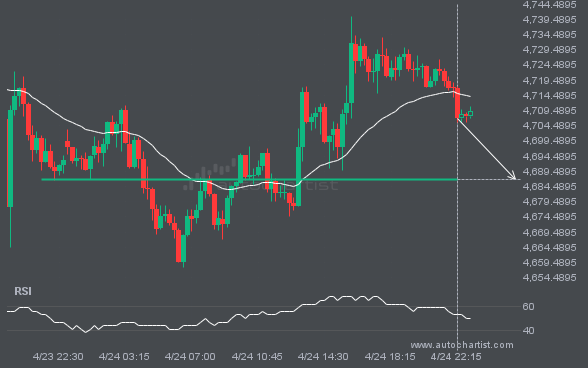
XAUUSD is approaching the line at 4686.9048. If this move continues, the price of XAUUSD could test 4686.9048 within the next 5 hours. But do not rush to trade. It has tested this line many times in the past, so the move could be short-lived and end in a rebound.
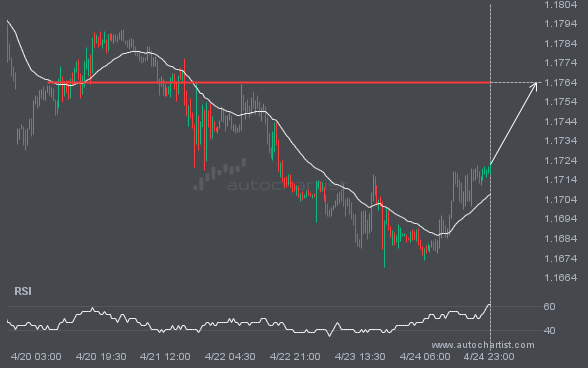
EURUSD is moving toward a level at 1.1764, which it has tested many times before. We have seen it retrace from this level before, so at this stage it isn’t clear whether it will break through this price or rebound again. If EURUSD continues on its current trajectory, we may see it move toward 1.1764 […]
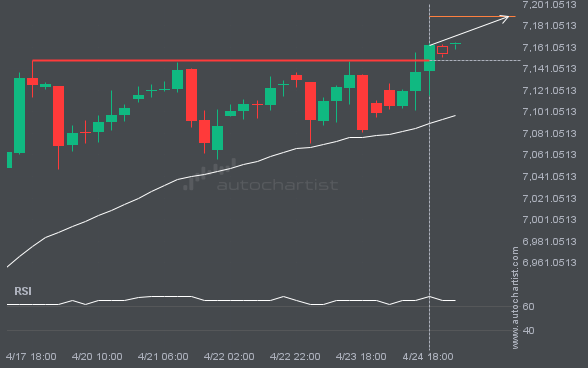
The price of S&P500 is heading toward 7189.4180. Despite the recent breakout through 7148.6401, it may struggle to gain momentum to reach the forecast price and could move back in the other direction. This has happened many times in the past, so watch for a possible bounce back.
Enjoy Access to Premium Autochartist
Trading Tools - Sign Up and Explore for Free Now!
Autochartist provides an extensive analytics toolset with features to take your trading to the next level. Empower your day-to-day trading decisions with an unrivalled breadth and depth of analysis driven by advanced algorithms, powerful big-data technology, and user-friendly trading tools.