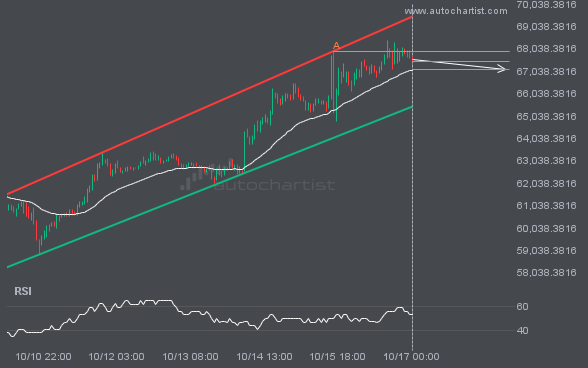
A Channel Up pattern was identified on BTCUSD at 67486.43, creating an expectation that it may move to the support line at 67117.6627. It may break through that line and continue the bearish trend or it may reverse from that line.
 Skip to content
 A Channel Up pattern was identified on BTCUSD at 67486.43, creating an expectation that it may move to the support line at 67117.6627. It may break through that line and continue the bearish trend or it may reverse from that line.
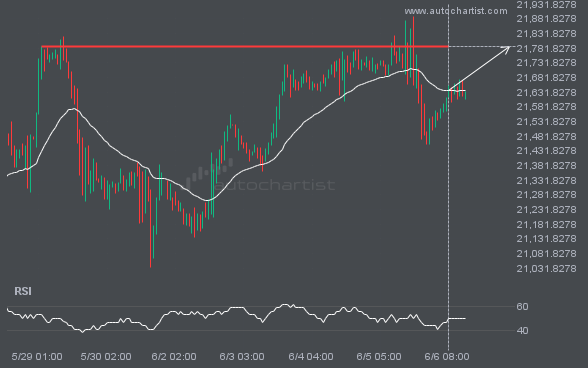
NAS100 is moving towards a key resistance level at 21788.2656. This is a previously tested level for NAS100. This could be a good trading opportunity, either at the spot price, or after breaching this level.

NGC/USD has broken through a resistance line. It has touched this line numerous times in the last 2 days. This breakout shows a potential move to 3.5381 within the next 8 hours. Because we have seen it retrace from this level in the past, one should wait for confirmation of the breakout.
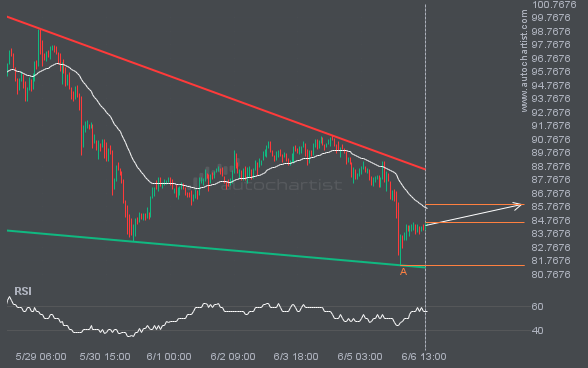
LTCUSD is trapped in a Falling Wedge formation, implying that a breakout is Imminent. This is a great trade-setup for both trend and swing traders. It is now approaching a support line that has been tested in the past. Divergence opportunists may be very optimistic about a possible breakout and this may be the start […]
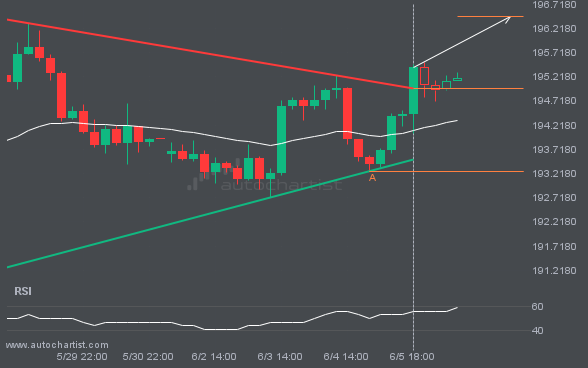
The last 9 4 hour candles on GBPJPY formed a Triangle pattern and broken out through the pattern lines, indicating a possible bullish movement towards the price level of 196.4590.
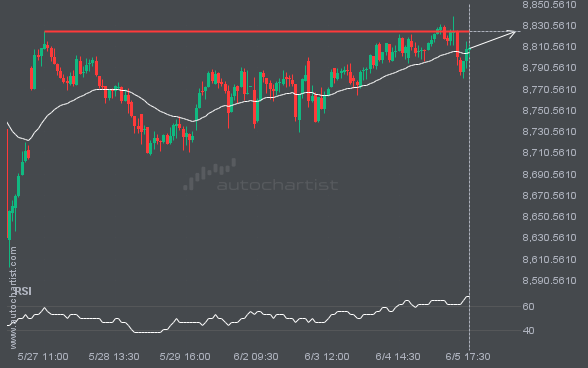
FTSE100 is about to retest a key horizontal resistance level near 8825.0703. It has tested this level 3 times in the recent past and could simply bounce off like it did last time. However, after this many tries, maybe it’s ready to start a new trend.
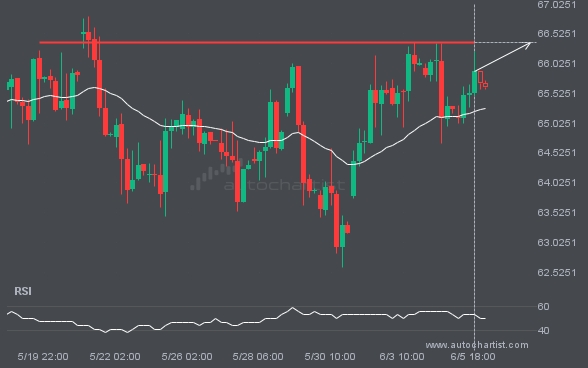
BRN/USD is about to retest a key horizontal resistance level near 66.3745. It has tested this level 3 times in the recent past and could simply bounce off like it did last time. However, after this many tries, maybe it’s ready to start a new trend.
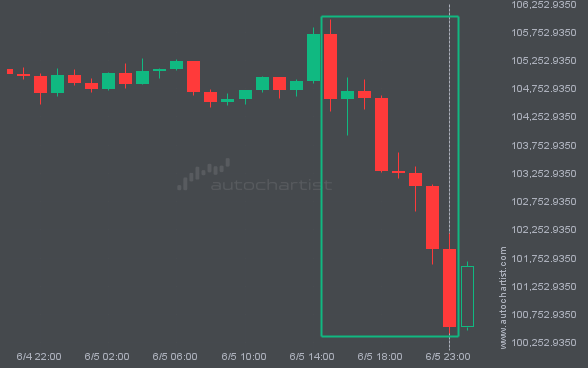
BTCUSD dropped sharply for 8 hours – which is an excessively big movement for this instrument; exceeding the 98% of past price moves. Even if this move is a sign of a new trend in BTCUSD there is a chance that we will witness a correction, no matter how brief.