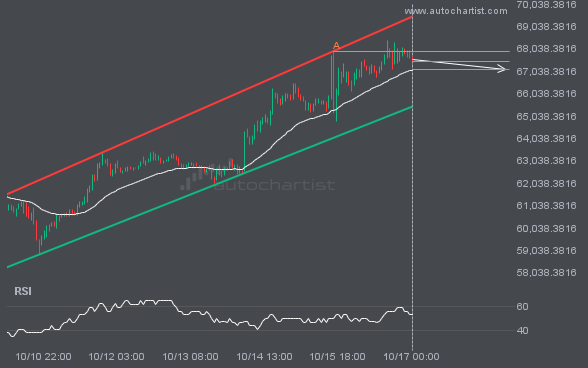
A Channel Up pattern was identified on BTCUSD at 67486.43, creating an expectation that it may move to the support line at 67117.6627. It may break through that line and continue the bearish trend or it may reverse from that line.
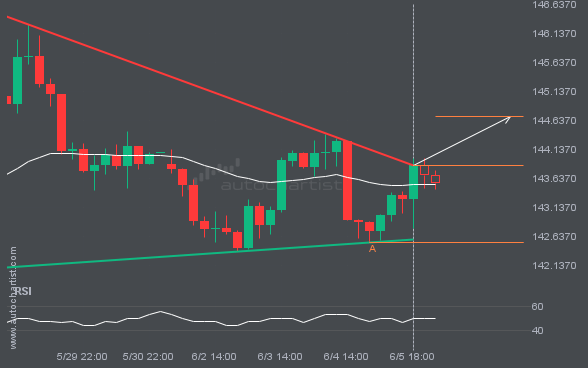
USDJPY has broken through a resistance line. It has touched this line at least twice in the last 10 days. This breakout may indicate a potential move to 144.7014 within the next 2 days. Because we have seen it retrace from this position in the past, one should wait for confirmation of the breakout before […]
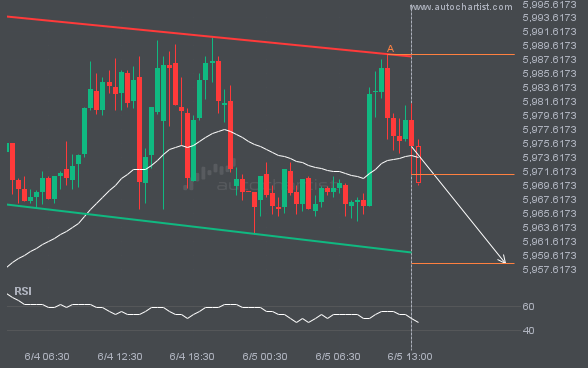
S&P500 is trapped in a Channel Down formation, implying that a breakout is Imminent. This is a great trade-setup for both trend and swing traders. It is now approaching a resistance line that has been tested in the past. Divergence opportunists may be very optimistic about a possible breakout and this may be the start […]
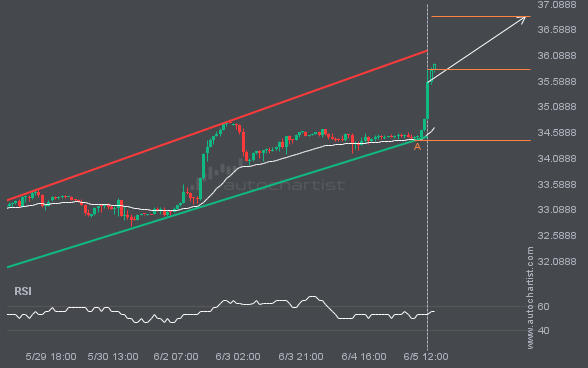
XAGUSD was identified at around 35.816 having recently rebounded of the support on the 1 hour data interval. Ultimately, the price action of the stock has formed a Channel Up pattern. This squeeze may increases the chances of a strong breakout. The projected movement will potentially take the price to around the 36.8449 level.
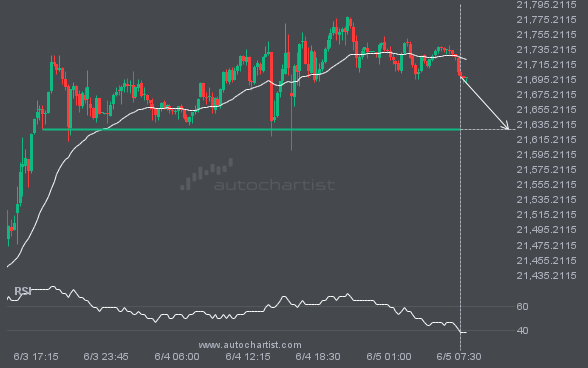
NAS100 is approaching a support line at 21628.4473. If it hits the support line, it may break through this level to continue the bearish trend, or it may turn around back to current levels.
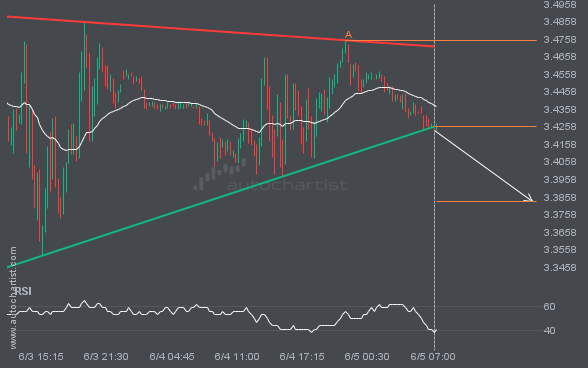
NGC/USD has broken through a support line. It has touched this line at least twice in the last 3 days. This breakout may indicate a potential move to 3.3833 within the next 12 hours. Because we have seen it retrace from this position in the past, one should wait for confirmation of the breakout before […]
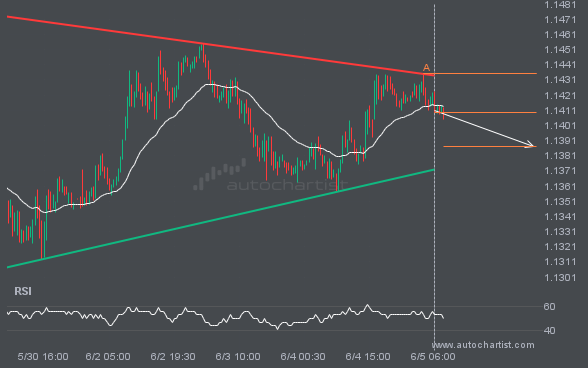
An emerging Triangle has been detected on EURUSD on the 30 Minutes chart. There is a possible move towards 1.1387 next few candles. Once reaching resistance it may continue its bearish run or reverse back to current price levels.
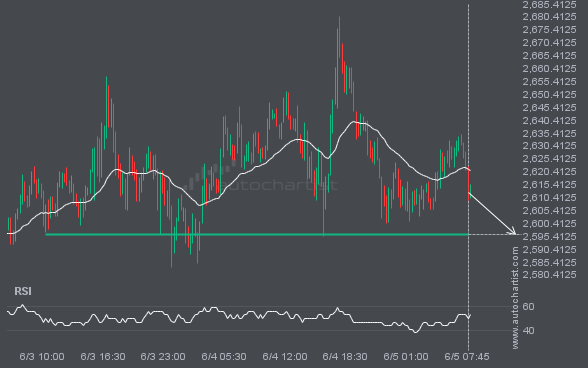
ETHUSD is approaching a support line at 2596.0300. If it hits the support line, it may break through this level to continue the bearish trend, or it may turn around back to current levels.