EURUSD is approaching a resistance line at 1.1413. If it hits the resistance line, it may break through this level to continue the bullish trend, or it may turn around back to current levels.
 Skip to content
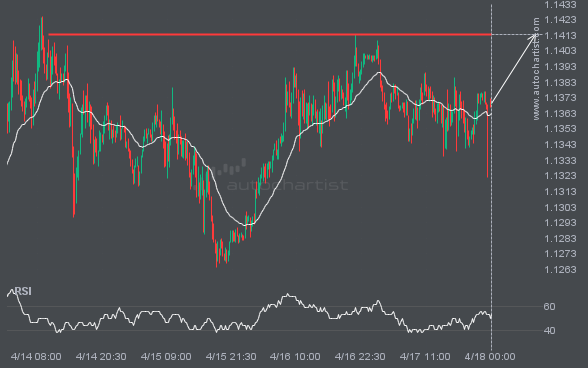
 EURUSD is approaching a resistance line at 1.1413. If it hits the resistance line, it may break through this level to continue the bullish trend, or it may turn around back to current levels.

GBPJPY has broken through a level at 213.5570, suggesting a possible move to 214.1310 within the next 13 hours. It has tested this level numerous times in the past, so you should wait for confirmation of this breakout before taking any action. If the breakout does not confirm, we could see a retracement back to […]

BRN/USD is heading toward the resistance line in a Rising Wedge pattern. If this move continues, the price of BRN/USD could test 112.4722 within the next 9 hours. It has tested this line many times before, so the move could be short-lived and may rebound as it has before.

EURUSD has moved through the support line of a Triangle pattern at 1.17606 on the 4 hour chart. This line has been tested multiple times in the past, and this breakout could signal an upcoming change in the current trend. Price may continue in the current direction toward 1.1721.

FTSE100 is moving toward a resistance line. Because it has retraced from this level in the past, we may see either a breakout through this line or a rebound to current levels. It has touched this line multiple times over the last 13 days and may test it again within the next 13 hours.

XAUUSD experienced an unusual number of bullish candles on the Daily timeframe.

Triangle pattern identified on LTCUSD has broken through a support level, with price momentum continuing to move downward. This presents a solid trading opportunity, with the price expected to reach 56.9210 in the next 10.

GBPJPY is approaching a support line at 213.3265. If it hits the support line, it may break through this level to continue the bearish trend, or it may return to current levels.