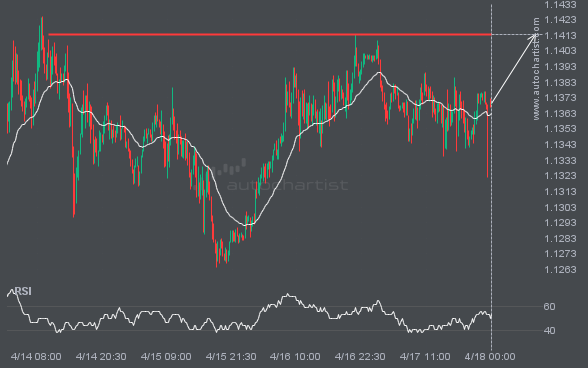
EURUSD is approaching a resistance line at 1.1413. If it hits the resistance line, it may break through this level to continue the bullish trend, or it may turn around back to current levels.
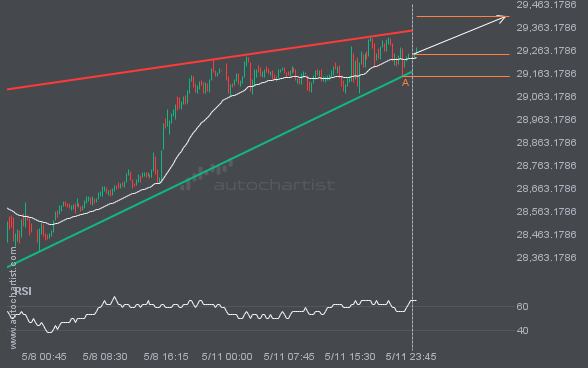
NAS100 is moving toward a resistance line. Since it has retraced from this line before, we may see either a breakout through this line or a rebound to current levels. It has touched this line numerous times in the last 5 days and may test it again within the next 15 hours.
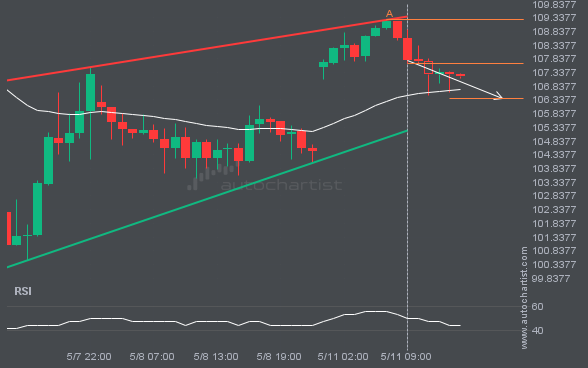
BRN/USD is moving toward a support line. Since it has retraced from this line before, we may see either a breakout through this line or a rebound to current levels. It has touched this line numerous times in the last 5 days and may test it again within the next 7 hours.
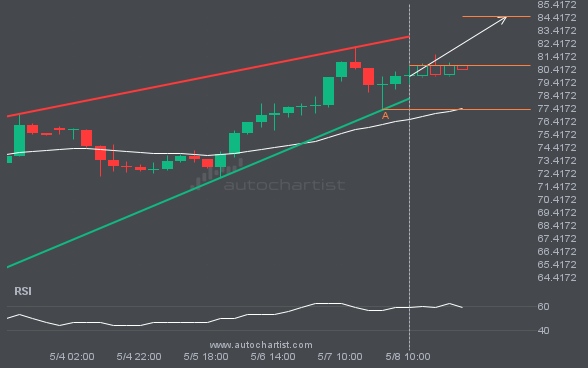
The movement of XAGUSD toward the resistance line of a Rising Wedge is yet another test of the line it has reached numerous times in the past. This test of the line could occur within the next 22 hours, but it is uncertain whether it will result in a breakout through this line or simply […]
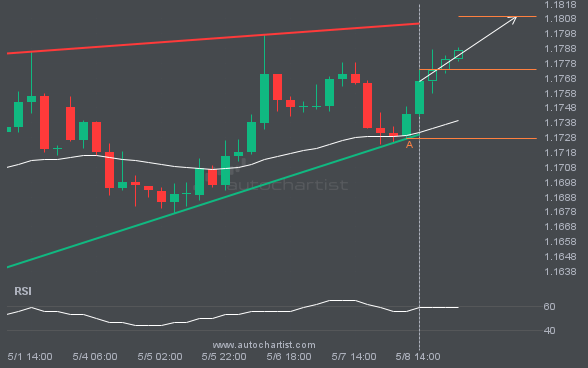
An emerging Rising Wedge has been detected on EURUSD. The pattern has not yet broken through support, but the price is expected to move up over the next few hours. At the time the pattern was found, the price was 1.17736, and it is expected to move to 1.1809.
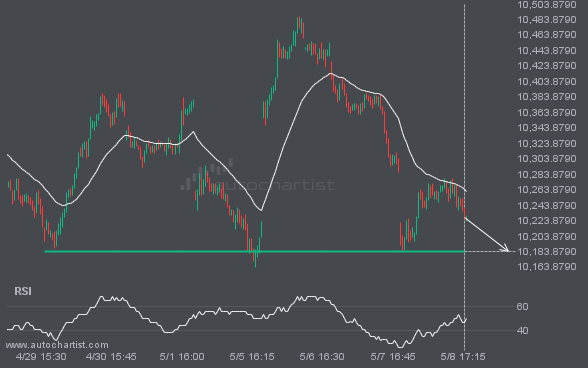
FTSE100 is about to retest a key horizontal support level near 10184.4102. It has tested this level 3 times recently and may simply bounce off it, as it did last time. However, after so many attempts, it may be ready to start a new trend.
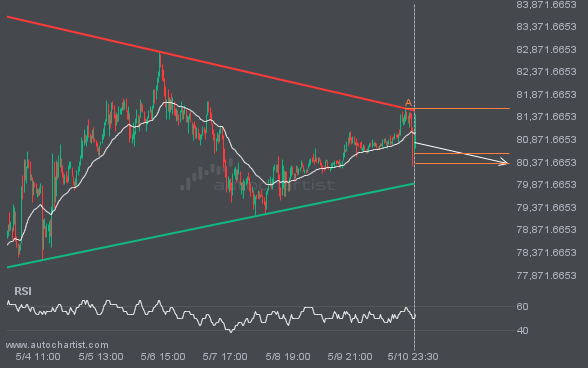
A Triangle pattern was identified for BTCUSD at 80571.96, suggesting it may move toward the support line at 80334.0450. It may break through that line and continue the bearish trend, or reverse from it.
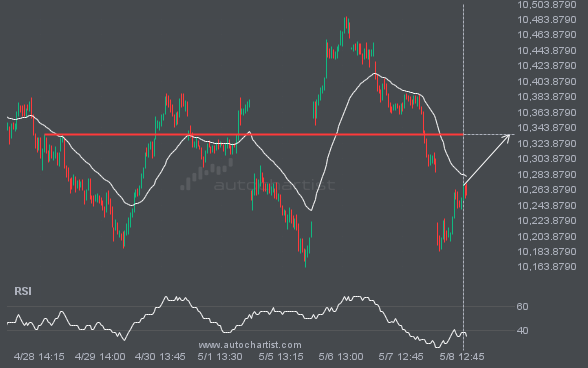
FTSE100 is approaching a resistance line at 10335.1396. If it hits the resistance line, it may break through this level to continue the bullish trend, or it may return to current levels.