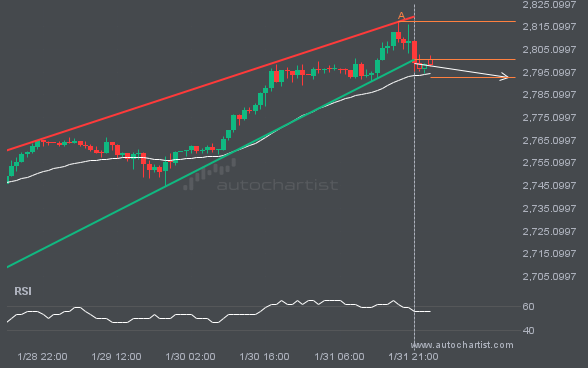
Rising Wedge pattern identified on XAUUSD has broken through a support level with the price momentum continuing to move in an downward direction. A solid trading opportunity continues with the price expected to reach 2792.5989 in the next 20.
 Skip to content
 Rising Wedge pattern identified on XAUUSD has broken through a support level with the price momentum continuing to move in an downward direction. A solid trading opportunity continues with the price expected to reach 2792.5989 in the next 20.
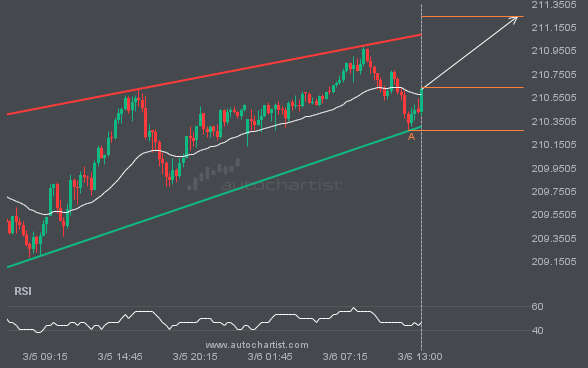
GBPJPY is moving toward a resistance line. Since it has retraced from this line before, we may see either a breakout through it or a rebound to current levels. It has touched this line multiple times in the past 2 days and may test it again within the next 9 hours.
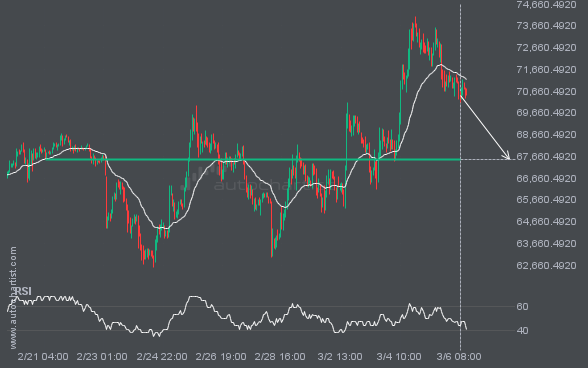
BTCUSD is heading toward 67528.5938 and could reach this level within the next 4 days. It has tested this level numerous times in the past, and this time could be no different, ending in a rebound rather than a breakout. If a breakout does not occur, we may see a retracement back to current levels.
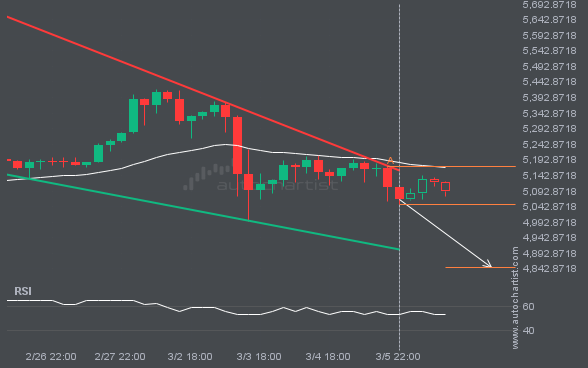
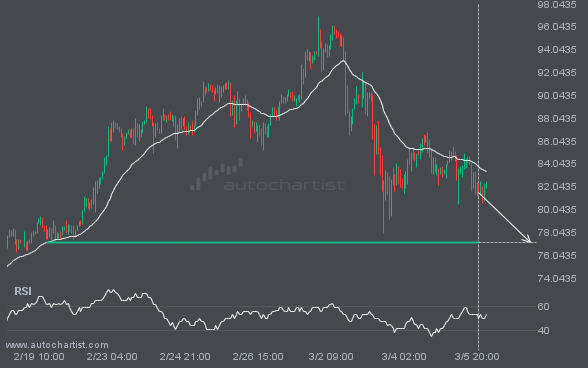
XAUUSD is heading toward the support line of a Falling Wedge pattern and could reach it within the next 2 days. It has tested this line numerous times before, and this time may be no different, ending in a rebound instead of a breakout. If a breakout doesn’t occur, we could see a retracement back […]
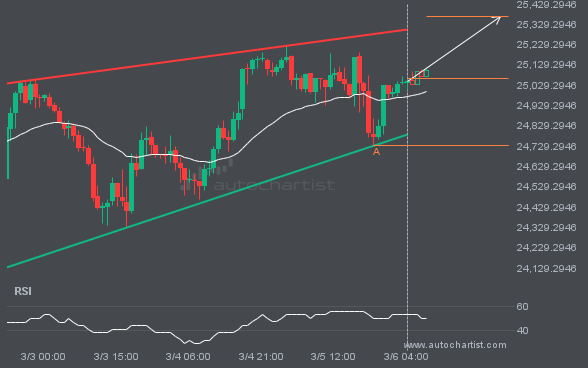
NAS100 is trapped in a Rising Wedge formation, implying that a breakout is imminent. This is a strong trade setup for both trend and swing traders. It is now approaching a support line that has been tested before. Divergence watchers may be optimistic about a potential breakout, which could mark the start of a new […]
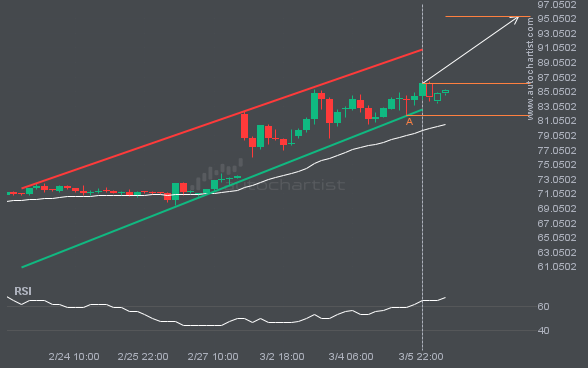
BRN/USD was identified around 86.188 after recently rebounding off the support on the 4 hour interval. Ultimately, the stock’s price action has formed a Channel Up pattern. This squeeze may increase the chances of a strong breakout. The projected move could take the price to around 95.3328.
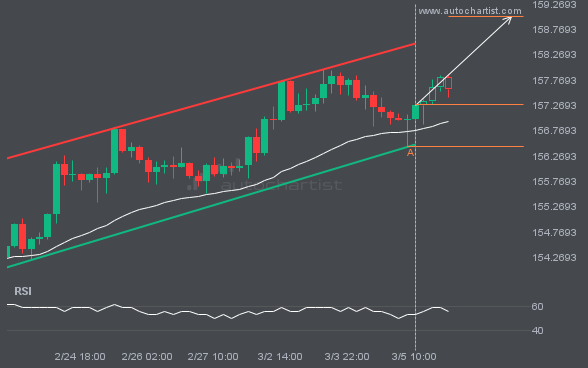
USDJPY is heading toward the resistance line of a Channel Up pattern and could reach it within the next 2 days. It has tested this line numerous times before, and this time may be no different, ending in a rebound instead of a breakout. If a breakout doesn’t occur, we could see a retracement back […]
XAGUSD is moving toward a key support level at 77.1916. This level has been tested before for XAGUSD. This may present a good trading opportunity either at the spot price or after a breakout through this level.