Autochartist General
MARKET ANALYSIS

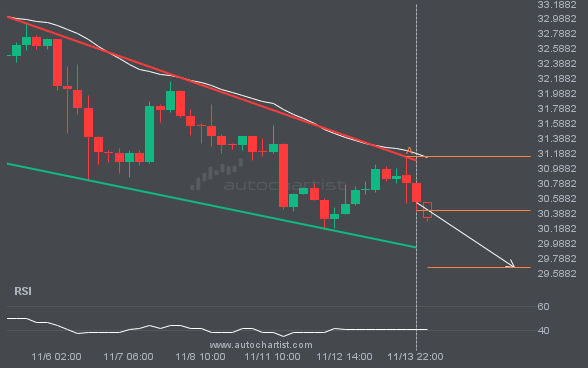
XAGUSD was identified at around 30.434 having recently rebounded of the resistance on the 4 hour data interval. Ultimately, the price action of the stock has formed a Falling Wedge pattern. This squeeze may increases the chances of a strong breakout. The projected movement will potentially take the price to around the 29.6726 level.
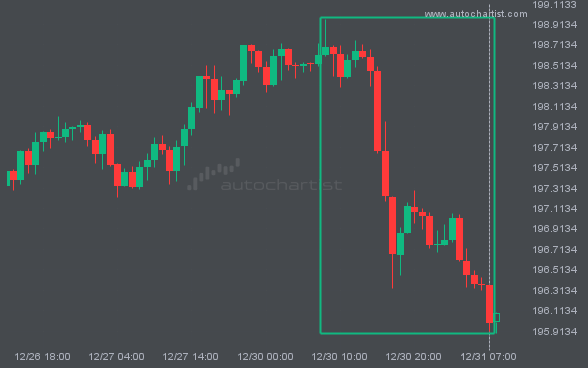
A movement of 7.74% over 16 hours on BTCUSD doesn’t go unnoticed. You may start considering where it’s heading next,

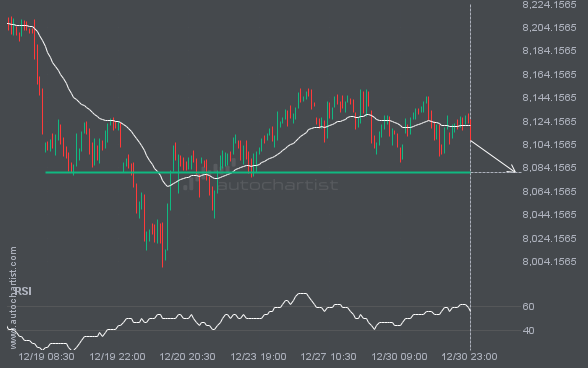
FTSE100 is moving towards a resistance line. Because we have seen it retrace from this level in the past, we

Emerging Rising Wedge pattern in its final wave was identified on the USDJPY 4 hour chart. After a strong bullish

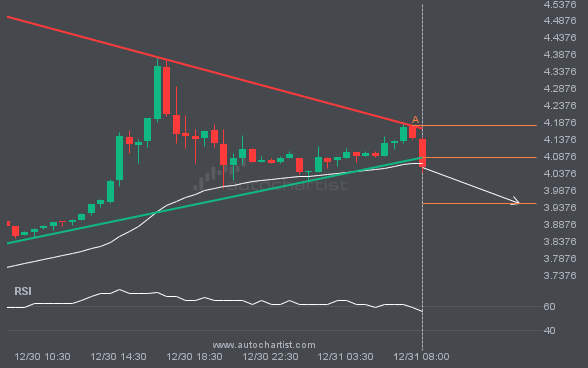
XAUUSD is approaching the support line of a Falling Wedge. It has touched this line numerous times in the last

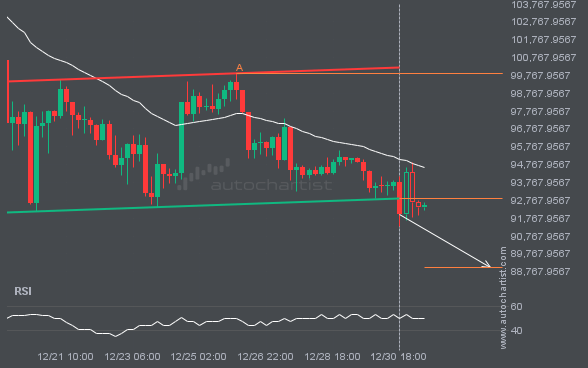
BRN/USD has broken through a support line. It has touched this line numerous times in the last 16 days. This

ETHUSD has experienced an extremely big movement in last 6 days. It may continue the trend, but this would make