...
MARKET ANALYSIS

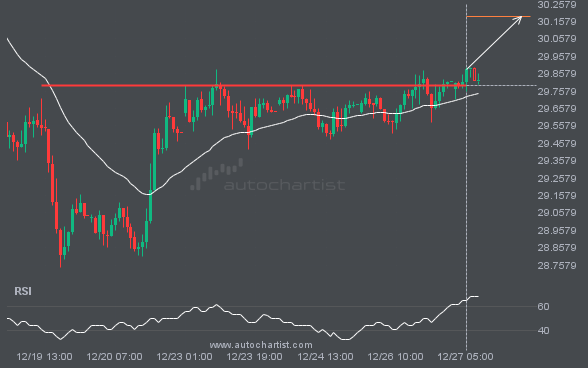
The price of XAGUSD in heading in the direction of 30.1858. Despite the recent breakout through 29.7910 it is possible that it will struggle to gain momentum to the forecast price and move back in the other direction. This has happened many times in the past so watch for a possible bounce back.

NGC/USD is approaching the line at 4.2575. If this move continues, the price of NGC/USD could test 4.2575 within the next 10 hours. But do not rush to trade. It has tested this line many times in the past, so the move could be short-lived and end in a rebound.

USDJPY is heading toward the resistance line in a Channel Up pattern. If this move continues, the price of USDJPY could test 155.9466 within the next 8 hours. It has tested this line many times before, so the move could be short-lived and may rebound as it has before.

A Channel Down pattern was identified for ETHUSD at 3030.84, suggesting it may move toward the resistance line at 3189.6250. It may break through that line and continue the bullish trend, or reverse from it.

LTCUSD has broken through the resistance line, which it has tested twice before. We have seen it retrace from this line before, so wait for confirmation of the breakout before trading. If this new trend persists, a target level around 98.4387 may materialize within the next 20 hours.

GBPJPY experienced an unusual number of bullish candles on the Daily timeframe.

S&P500 is approaching the line at 6727.1401. If this move continues, the price of S&P500 could test 6727.1401 within the next 9 hours. But do not rush to trade. It has tested this line many times in the past, so the move could be short-lived and end in a rebound.

An emerging Triangle pattern in its final wave has been identified on the XAUUSD 15 Minutes chart. After a strong bearish run, XAUUSD is heading toward the upper triangle trendline, with possible resistance at 4062.2516. If the support holds, the Triangle pattern suggests a rebound toward current levels.