MARKET ANALYSIS

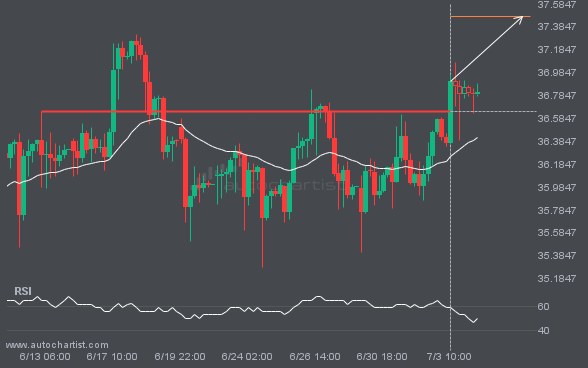
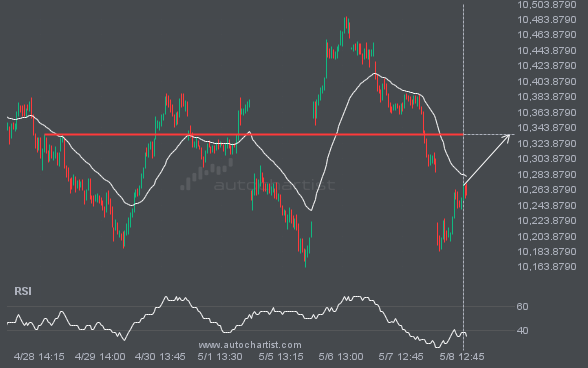
XAGUSD is once again retesting a key horizontal resistance level at 36.6419. It has tested this level 4 times in the recent past and could simply bounce off like it did last time. However, after this many tries, maybe it’s ready to start a new trend.

Emerging Rising Wedge detected on BRN/USD – the pattern is an emerging one and has not yet broken through support, but the price is expected to move up over the next few hours. The price at the time the pattern was found was 69.843 and it is expected to move to 71.2309.

NAS100 is heading towards 22614.4590 and could reach this point within the next 11 hours. It has tested this line numerous times in the past, and this time could be no different, ending in a rebound instead of a breakout. If the breakout doesn’t happen, we could see a retracement back down to current levels.

After posting 5 consecutive bearish candles in 4 days, you may start considering where GBPJPY is heading next, a continuation of the current downward trend, or a reversal in the previous direction.

LTCUSD has breached the resistance line at 88.6100. It may continue the bullish trend towards 90.7920, or, it may prove to be yet another test of this level.

USDJPY has broken through the resistance line of a Falling Wedge technical chart pattern. Because we have seen it retrace from this line in the past, one should wait for confirmation of the breakout before taking any action. It has touched this line twice in the last 20 days and suggests a possible target level […]

A strong support level has been identified at 8708.4297 on the 1 hour FTSE100 chart. FTSE100 is likely to test it soon.

EURUSD has experienced an unusual quantity of bullish candles on the Daily timeframe. This is in the 0.949999988079071 percentile of movements and so we could see a slight pullback over the next few candles.