MARKET ANALYSIS

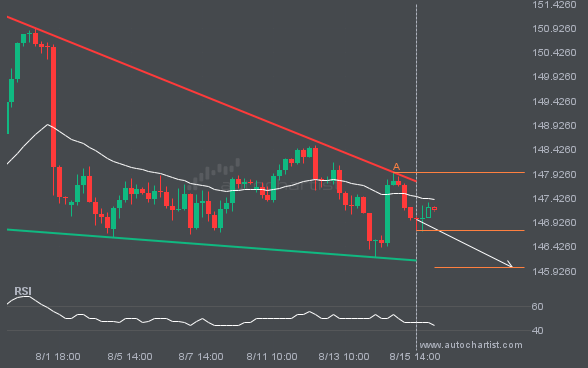
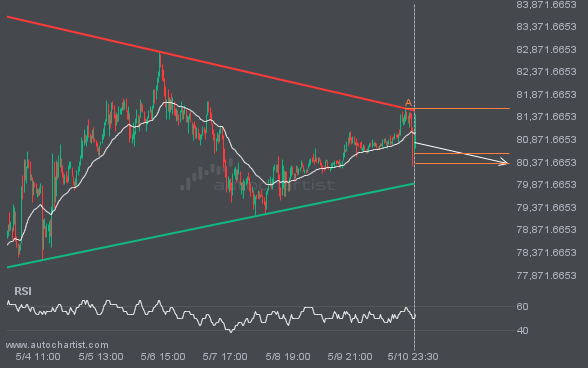
The movement of USDJPY towards the support line of a Falling Wedge is yet another test of the line it reached numerous times in the past. This line test could happen in the next 4 days, but it is uncertain whether it will result in a breakout through this line, or simply rebound back to current levels.

BTCUSD has broken through 117866.3516 which it has tested numerous times in the past. We have seen it retrace from this price in the past. If this new trend persists, BTCUSD may be heading towards 114296.9844 within the next 3 days.

NGC/USD is heading towards the support line of a Channel Up and could reach this point within the next 15 hours. It has tested this line numerous times in the past, and this time could be no different from the past, ending in a rebound instead of a breakout. If the breakout doesn’t happen, we […]

Emerging Falling Wedge pattern in its final wave was identified on the USDJPY 4 hour chart. After a strong bearish run, we find USDJPY heading towards the upper triangle line with a possible resistance at 145.9816. If the support shows to hold, the Falling Wedge pattern suggests a rebound back towards current levels.

XAUUSD is moving towards a resistance line. Because we have seen it retrace from this level in the past, we could see either a break through this line, or a rebound back to current levels. It has touched this line numerous times in the last 4 days and may test it again within the next […]

ETHUSD is heading towards the resistance line of a Channel Up and could reach this point within the next 3 days. It has tested this line numerous times in the past, and this time could be no different from the past, ending in a rebound instead of a breakout. If the breakout doesn’t happen, we […]

BTCUSD has broken through a support line of a Channel Up and suggests a possible movement to 115838.1303 within the next 2 days. It has tested this line in the past, so one should probably wait for a confirmation of this breakout before taking action. If the breakout doesn’t confirm, we could see a retracement […]

FTSE100 has broken through a resistance line. It has touched this line numerous times in the last 18 days. This breakout shows a potential move to 9220.1670 within the next 2 days. Because we have seen it retrace from this level in the past, one should wait for confirmation of the breakout.