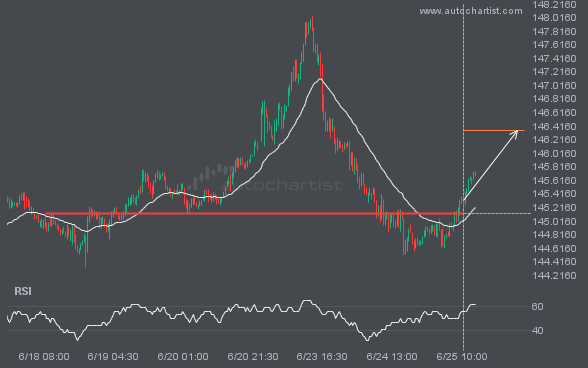
USDJPY has broken through a line of 145.1300 and suggests a possible movement to 146.3557 within the next 2 days. It has tested this line numerous times in the past, so one should wait for a confirmation of this breakout before taking any action. If the breakout doesn’t confirm, we could see a retracement back to lines seen in the last 8 days.