MARKET ANALYSIS

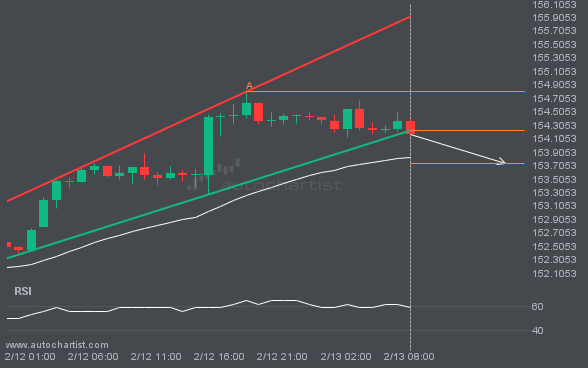
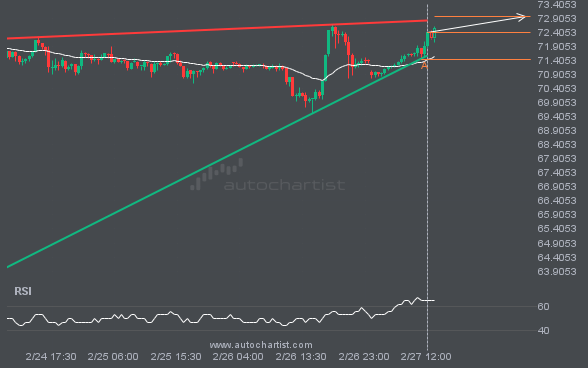
USDJPY has broken through the support line which it has tested twice in the past. We have seen it retrace from this line before, so one should wait for confirmation of the breakout before trading. If this new trend persists, a target level of around 153.7300 may materialize within the next 9 hours.

BTCUSD is approaching the resistance line of a Channel Down. It has touched this line numerous times in the last 4 days. If it tests this line again, it should do so in the next 21 hours.

S&P500 is moving towards a key resistance level at 5923.4502. This is a previously tested level for S&P500. This could be a good trading opportunity, either at the spot price, or after breaching this level.

EURUSD is heading towards the resistance line of a Rising Wedge and could reach this point within the next 2 days. It has tested this line numerous times in the past, and this time could be no different from the past, ending in a rebound instead of a breakout. If the breakout doesn’t happen, we […]

XAGUSD is moving towards a resistance line. Because we have seen it retrace from this line before, we could see either a break through this line, or a rebound back to current levels. It has touched this line numerous times in the last 3 days and may test it again within the next 5 hours.

LTCUSD is approaching a support line at 92.9100. If it hits the support line, it may break through this level to continue the bearish trend, or it may turn around back to current levels.

A strong support level has been identified at 143.8530 on the 30 Minutes USDJPY chart. USDJPY is likely to test it soon.

FTSE100 was identified at around 8777.07 having recently rebounded of the support on the 4 hour data interval. Ultimately, the price action of the stock has formed a Channel Up pattern. This squeeze may increases the chances of a strong breakout. The projected movement will potentially take the price to around the 8923.2684 level.