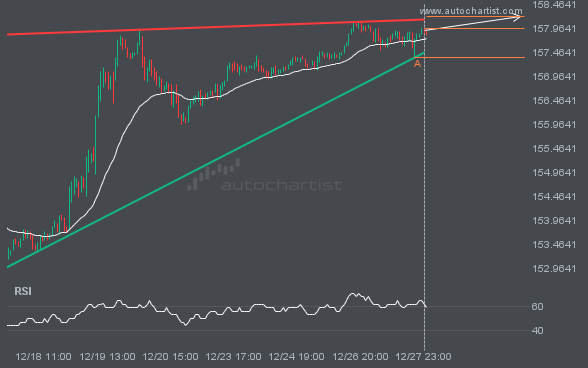
USDJPY is approaching the resistance line of a Ascending Triangle. It has touched this line numerous times in the last 12 days. If it tests this line again, it should do so in the next 3 days.
 Skip to content
 USDJPY is approaching the resistance line of a Ascending Triangle. It has touched this line numerous times in the last 12 days. If it tests this line again, it should do so in the next 3 days.

EURUSD has broken through a support line of a Triangle chart pattern. If this breakout holds true, we may see the price of EURUSD testing 1.0810 within the next 8 hours. But don’t be so quick to trade, it has tested this line in the past, so you should confirm the breakout before taking any […]
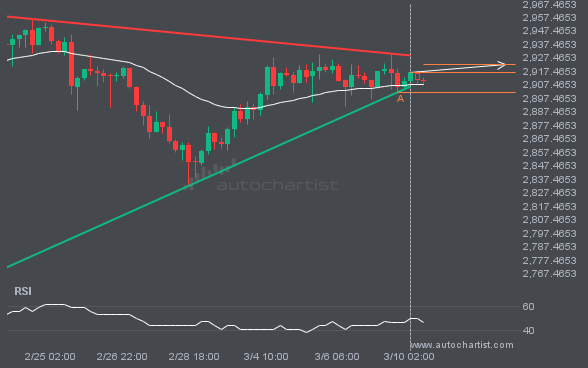
XAUUSD was identified at around 2917.02 having recently rebounded of the support on the 4 hour data interval. Ultimately, the price action of the stock has formed a Triangle pattern. This squeeze may increases the chances of a strong breakout. The projected movement will potentially take the price to around the 2922.3600 level.
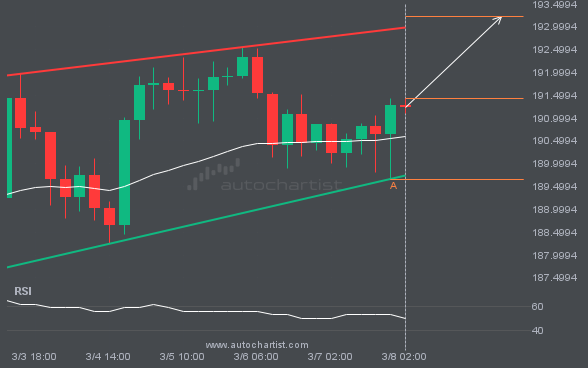
An emerging Rising Wedge has been detected on GBPJPY on the 4 hour chart. There is a possible move towards 193.2247 next few candles. Once reaching support it may continue its bullish run or reverse back to current price levels.
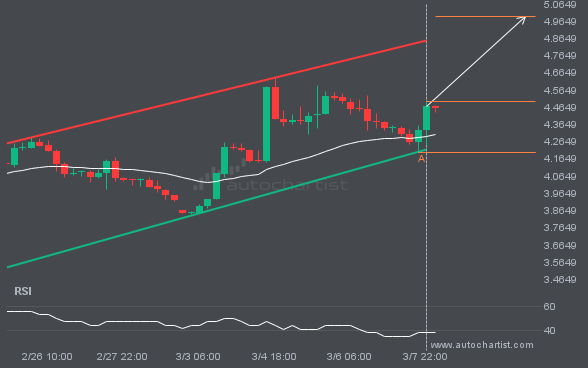
NGC/USD is moving towards a resistance line which it has tested numerous times in the past. We have seen it retrace from this line before, so at this stage it isn’t clear whether it will breach this line or rebound as it did before. If NGC/USD continues in its current trajectory, we could see it […]
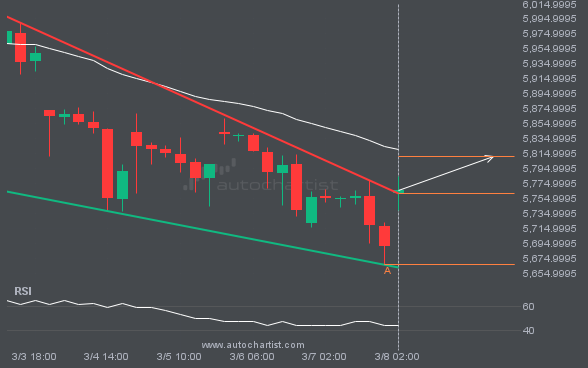
You would be well advised to confirm the breakout that has just occurred – do you believe the move through resistance to be significant? Do you have confirming indicators that the price momentum will continue? If so, look for a target of 5810.7398 but consider reducing the size of your position as the price gets […]
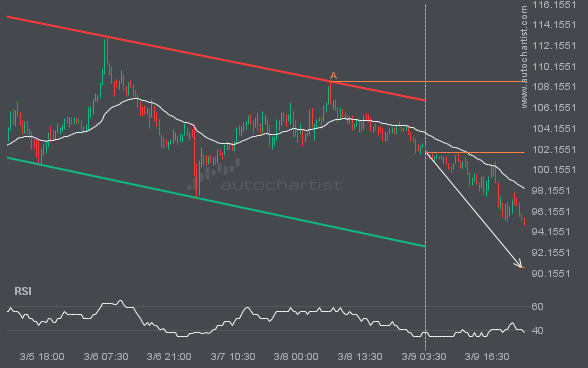
LTCUSD was identified at around 101.83 having recently rebounded of the resistance on the 30 Minutes data interval. Ultimately, the price action of the stock has formed a Channel Down pattern. This squeeze may increases the chances of a strong breakout. The projected movement will potentially take the price to around the 90.7303 level.
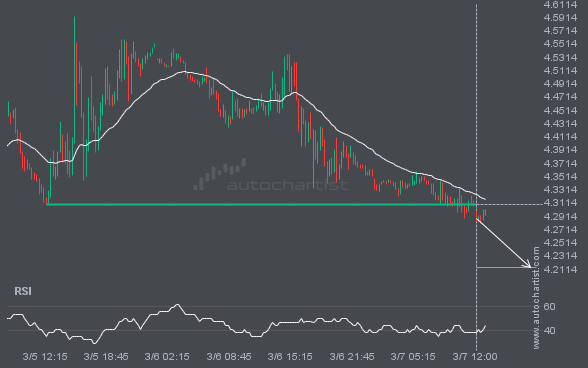
NGC/USD has broken through a line of 4.3090 and suggests a possible movement to 4.2140 within the next 10 hours. It has tested this line numerous times in the past, so one should wait for a confirmation of this breakout before taking any action. If the breakout doesn’t confirm, we could see a retracement back […]