MARKET ANALYSIS

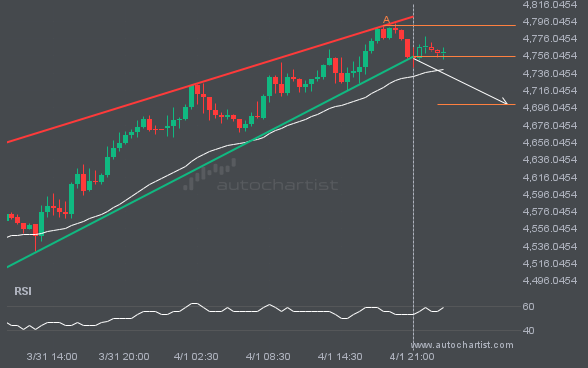
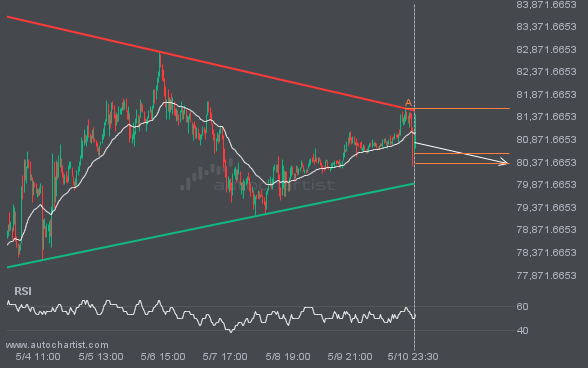
XAUUSD has broken through the support line of a Rising Wedge technical chart pattern. Because it has retraced from this line in the past, you should wait for confirmation of the breakout before taking any action. It has touched this line twice in the last 2 days, suggesting a possible target level around 4700.4356 within the next 8 hours.

The last 20 4 hour candles on FTSE100 have formed a Triangle pattern and broken out through the pattern lines, indicating a possible bullish movement toward the price level at 10243.9850.

An emerging Ascending Triangle pattern in its final wave has been identified on the XAGUSD 1 hour chart. After a strong bullish run, XAGUSD is heading toward the upper triangle trendline, with possible resistance at 74.5846. If the resistance holds, the Ascending Triangle pattern suggests a rebound toward current levels.

USDJPY is moving toward a resistance line. Since it has retraced from this line before, we may see either a breakout through it or a rebound to current levels. It has touched this line multiple times in the past 12 days and may test it again within the next 2 days.

ETHUSD is heading toward 2092.2900 and could reach this level within the next 2 days. It has tested this level numerous times in the past, and this time could be no different, ending in a rebound rather than a breakout. If a breakout does not occur, we may see a retracement back to current levels.

The movement of S&P500 toward the resistance line of a Channel Down is yet another test of the line it has reached numerous times in the past. This test of the line could occur within the next 3 days, but it is uncertain whether it will result in a breakout through this line or simply […]

The movement of XAUUSD towards the 4569.0298 price line is yet another test of a line it has reached numerous times in the past. We can expect this test to occur within the next 2 days, but it is uncertain whether it will result in a breakout through this line or simply rebound to current […]

EURUSD is heading toward the support line of a Channel Down pattern and could reach it within the next 17 hours. It has tested this line numerous times before, and this time may be no different, ending in a rebound instead of a breakout. If a breakout doesn’t occur, we could see a retracement back […]