Skip to content
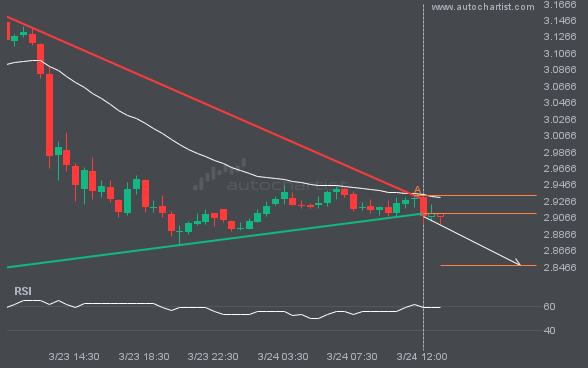
 NGC/USD has broken through the support line of a Triangle pattern and suggests a possible move to 2.8486 within the next 6 hours. It has tested this line before, so it is prudent to wait for confirmation of the breakout before taking action. If the breakout is not confirmed, we could see a retracement back to levels seen over the last 2 days.