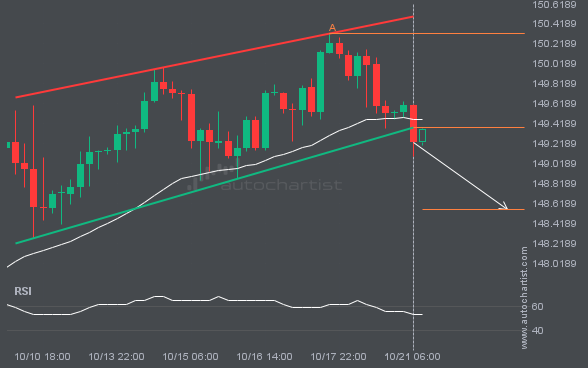
USDJPY moved through the support line of a Channel Up at 149.38331818181823 on the 4 hour chart. This line has been tested a number of times in the past and this breakout could mean an upcoming change from the current trend. It may continue in its current direction toward 148.5526.