Daily Top Trade Setups: Advanced Forex, Indices, Commodities, and Stock Analysis
An important resistance line is being approached by FTSE100. This price has been tested numerous times in the last 14 days
An emerging Channel Down has been detected on FTSE100. The pattern has not yet broken through support, but the price is expected to move up over the next few hours. At the time the pattern was found, the price was 10209.23, and it is expected to move to 10281.8381.
LTCUSD is heading toward a price it has tested 5 times recently.
LTCUSD is approaching a critical level that could be a key deciding factor for what comes next. We may see this trajectory continue to test and break through 53.6000, unless it loses momentum and pulls back to current levels.
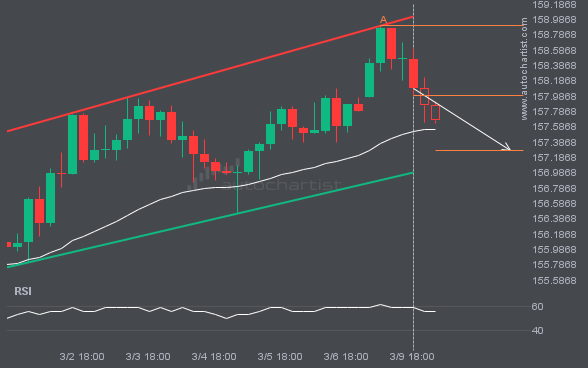
After repeatedly testing the support line, USDJPY is once again approaching it. Can we expect a bearish trend to emerge?
A Channel Up pattern was identified for USDJPY at 157.997, suggesting it may move toward the support line at 157.2817. It may break through that line and continue the bearish trend, or reverse from it.
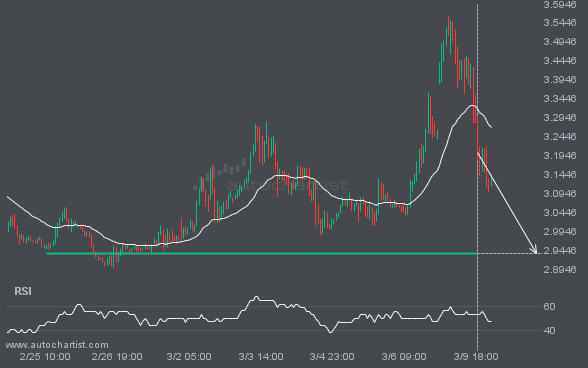
NGC/USD is approaching 2.9370. We expect either a breakout above this level or a rebound.
The movement of NGC/USD towards the 2.9370 price line is yet another test of a line it has reached numerous times in the past. We can expect this test to occur within the next 2 days, but it is uncertain whether it will result in a breakout through this line or simply rebound to current […]
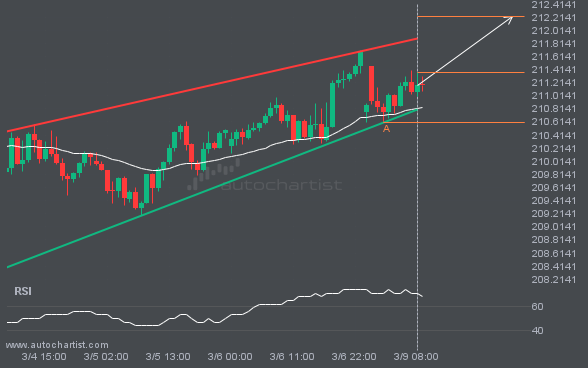
Consider a move on GBPJPY as it heads toward resistance.
An emerging Rising Wedge pattern has been detected for GBPJPY on the 1 hour chart. There may be a move toward 212.2226 in the next few candles. Once it reaches the resistance, it may continue its bullish run or revert to current price levels.
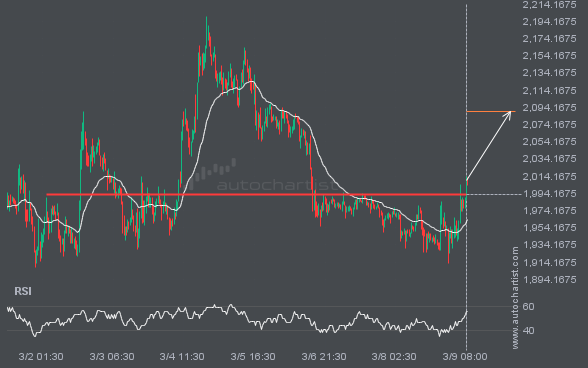
Significant movement is possible in ETHUSD after a breach of 1992.7300.
ETHUSD has broken through 1992.7300, which it has tested many times before. We have also seen it retrace from this level. If this new trend persists, ETHUSD may be heading towards 2089.6680 within the next 2 days.
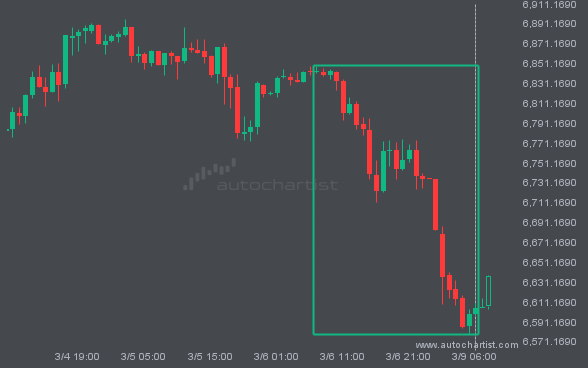
S&P500 moves lower to 6604.29 in the last 3 days.
S&P500 has moved lower by 3.48% from 6842.53 to 6604.29 in the last 3 days.
Latest company news, corporate actions and partnership announcements
Interesting trading articles, ideas, and thought leadership
Ask your broker today or sign up for a demo from the Technical Analysis page.