Daily Top Trade Setups: Advanced Forex, Indices, Commodities, and Stock Analysis
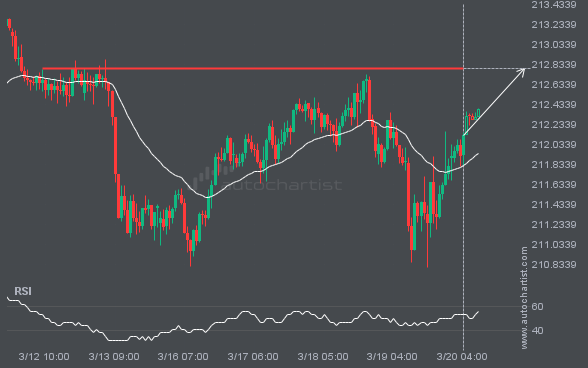
GBPJPY is heading toward a price it has tested 4 times recently.
GBPJPY is about to retest a key horizontal resistance level near 212.7880. It has tested this level 4 times recently and may simply bounce off it, as it did last time. However, after so many attempts, it may be ready to start a new trend.
If BTCUSD touches 72153.8594, it may be time to take action.
BTCUSD is moving toward a resistance line. Because it has retraced from this level in the past, we may see either a breakout through this line or a rebound to current levels. It has touched this line multiple times over the last 8 days and may test it again within the next 2 days.
NAS100 is approaching the resistance line of a Channel Down pattern. We anticipate either a breakout through this line or a rebound.
NAS100 is moving toward a resistance line. Since it has retraced from this line before, we may see either a breakout through this line or a rebound to current levels. It has touched this line numerous times in the last 12 days and may test it again within the next 3 days.
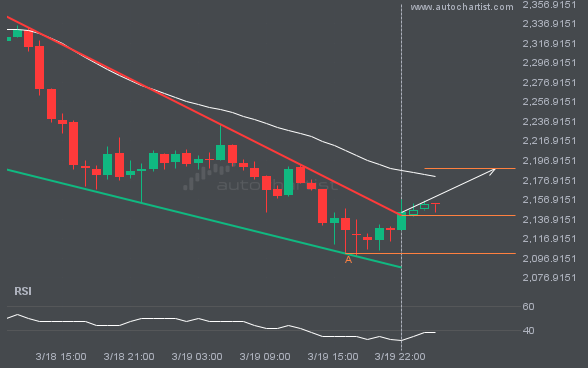
An interesting opportunity in ETHUSD after breaking 2141.0511764705884.
Falling Wedge pattern identified on ETHUSD has broken through a resistance level, with price momentum continuing to move upward. This presents a solid trading opportunity, with the price expected to reach 2189.2889 in the next 7.
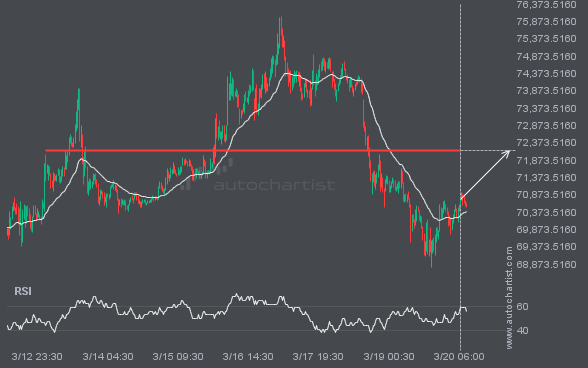
BRN/USD is heading toward a price it has tested 4 times recently.
The movement of BRN/USD towards the 99.6420 price line is yet another test of a line it has reached numerous times in the past. We can expect this test to occur within the next 2 days, but it is uncertain whether it will result in a breakout through this line or simply rebound to current […]
Because XAUUSD has formed a Channel Down pattern, we expect it to touch the resistance line. If it breaks through the resistance, it may move much higher.
The movement of XAUUSD toward the resistance line of a Channel Down is yet another test of the line it has reached numerous times in the past. This test of the line could occur within the next 2 days, but it is uncertain whether it will result in a breakout through this line or simply […]
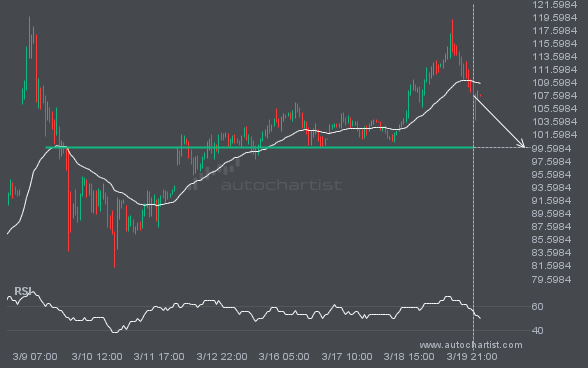
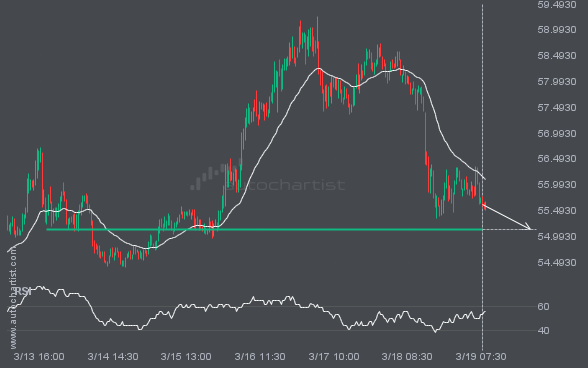
If you’re long on LTCUSD, be aware of the rapidly approaching level at 55.1300.
LTCUSD is moving toward a support line. Because it has retraced from this level in the past, we may see either a breakout through this line or a rebound to current levels. It has touched this line multiple times over the last 6 days and may test it again within the next 2 days.
Latest company news, corporate actions and partnership announcements
Interesting trading articles, ideas, and thought leadership
Ask your broker today or sign up for a demo from the Technical Analysis page.