Skip to content
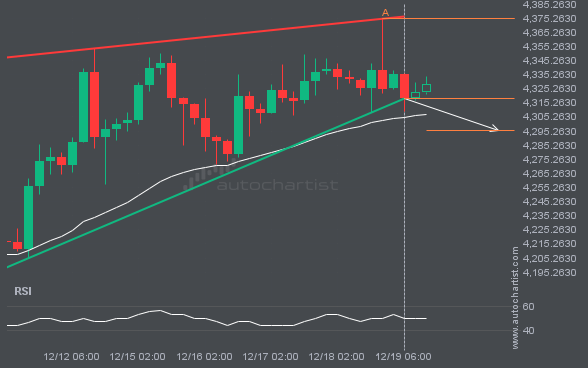
 XAUUSD has broken through the support line, which it has tested twice before. We have seen it retrace from this line before, so wait for confirmation of the breakout before trading. If this new trend persists, a target level around 4295.5352 may materialize within the next 2 days.
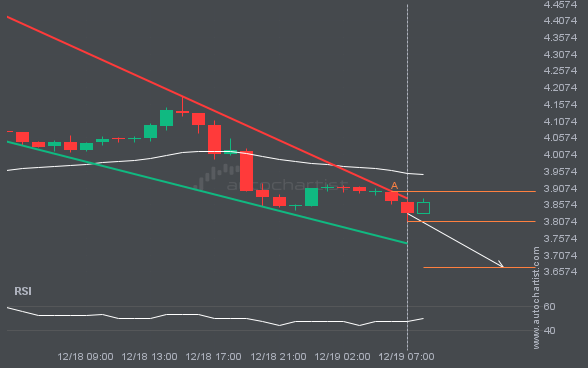
An emerging Falling Wedge pattern has been detected for NGC/USD on the 1 hour chart. There may be a move toward 3.6705 in the next few candles. Once it reaches the support, it may continue its bearish run or revert to current price levels.
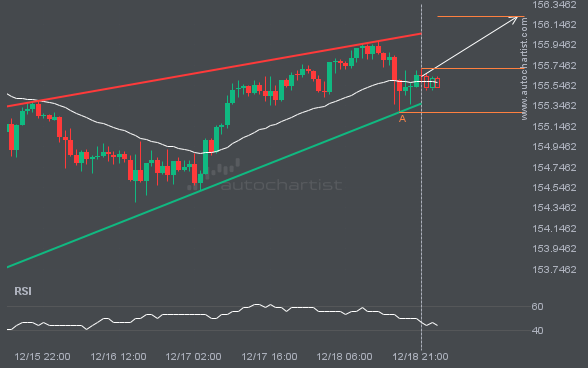
A Rising Wedge pattern was identified for USDJPY at 155.7115, suggesting it may move toward the resistance line at 156.2232. It may break through that line and continue the bullish trend, or reverse from it.
FTSE100 is moving toward a resistance line. Since it has retraced from this line before, we may see either a breakout through it or a rebound to current levels. It has touched this line multiple times in the past 10 days and may test it again within the next 13 hours.

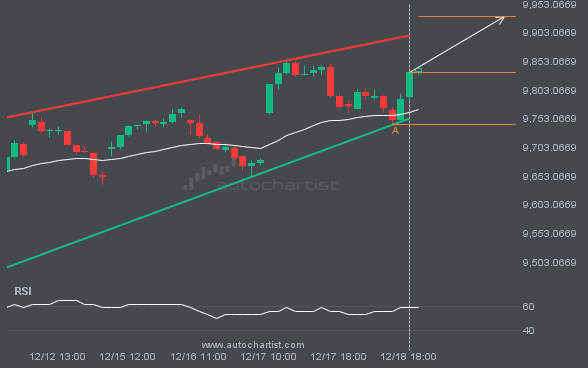
NAS100 is moving toward a resistance line it has tested many times. It has retraced from this line before, so it’s unclear whether it will break through or rebound again. If NAS100 continues on its current trajectory, it could reach 25048.5804 within the next 2 days.
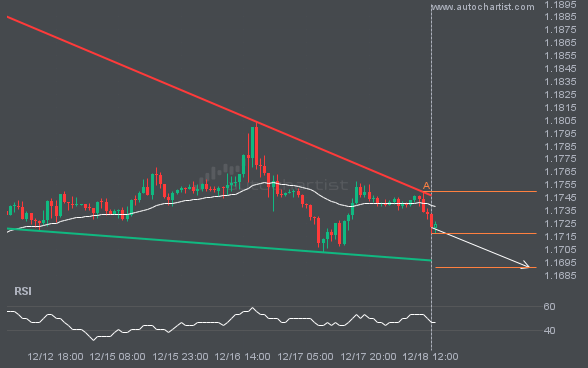
EURUSD is moving toward a support line it has tested many times. It has retraced from this line before, so it’s unclear whether it will break through or rebound again. If EURUSD continues on its current trajectory, it could reach 1.1691 within the next 2 days.