Daily Top Trade Setups: Advanced Forex, Indices, Commodities, and Stock Analysis
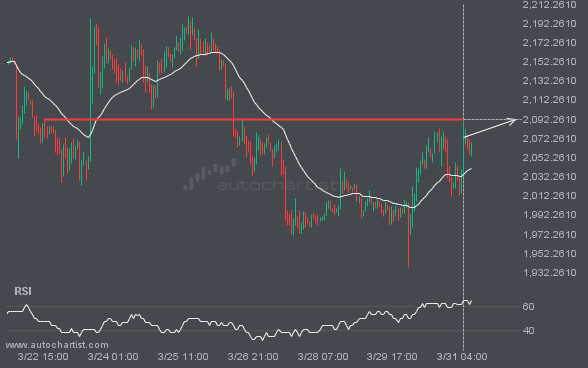
ETHUSD keeps moving closer to 2092.2900. Will it finally breach this level?
ETHUSD is heading toward 2092.2900 and could reach this level within the next 2 days. It has tested this level numerous times in the past, and this time could be no different, ending in a rebound rather than a breakout. If a breakout does not occur, we may see a retracement back to current levels.
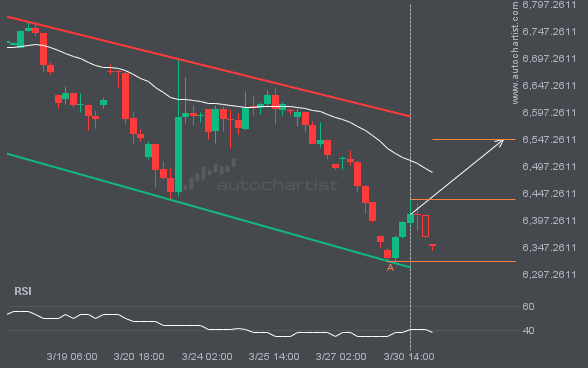
Because S&P500 has formed a Channel Down pattern, we expect it to touch the resistance line. If it breaks through the resistance, it may move much higher.
The movement of S&P500 toward the resistance line of a Channel Down is yet another test of the line it has reached numerous times in the past. This test of the line could occur within the next 3 days, but it is uncertain whether it will result in a breakout through this line or simply […]
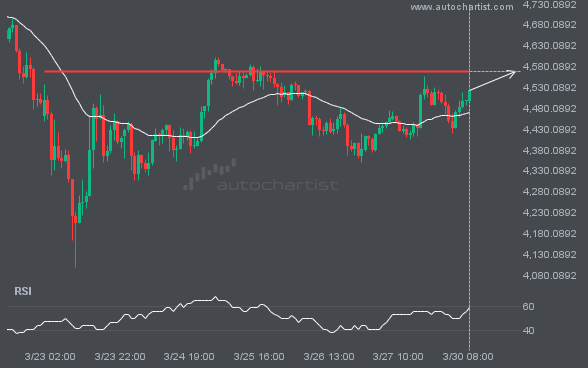
XAUUSD is heading toward a price it has tested 5 times recently.
The movement of XAUUSD towards the 4569.0298 price line is yet another test of a line it has reached numerous times in the past. We can expect this test to occur within the next 2 days, but it is uncertain whether it will result in a breakout through this line or simply rebound to current […]
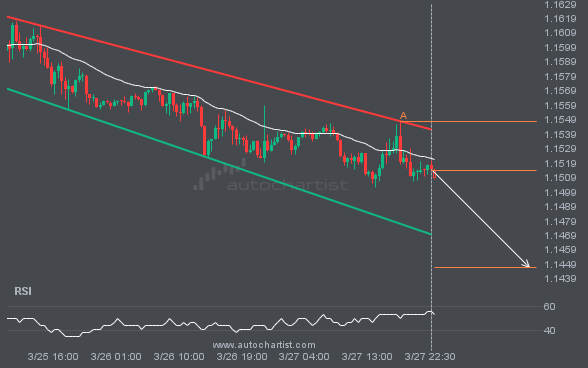
EURUSD is approaching a support line that has been tested at least twice before
EURUSD is heading toward the support line of a Channel Down pattern and could reach it within the next 17 hours. It has tested this line numerous times before, and this time may be no different, ending in a rebound instead of a breakout. If a breakout doesn’t occur, we could see a retracement back […]
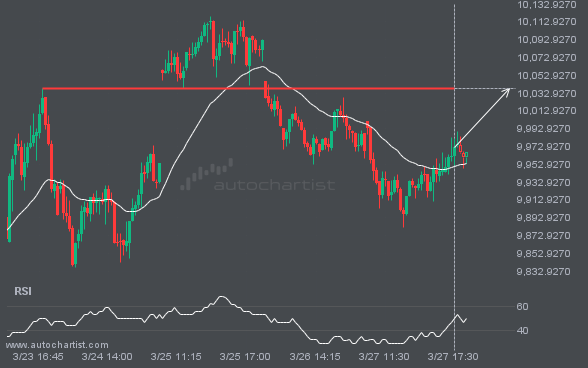
FTSE100 is heading toward a price it has tested 3 times recently.
FTSE100 is about to retest a key horizontal resistance level near 10037.7598. It has tested this level 3 times recently and may simply bounce off it, as it did last time. However, after so many attempts, it may be ready to start a new trend.
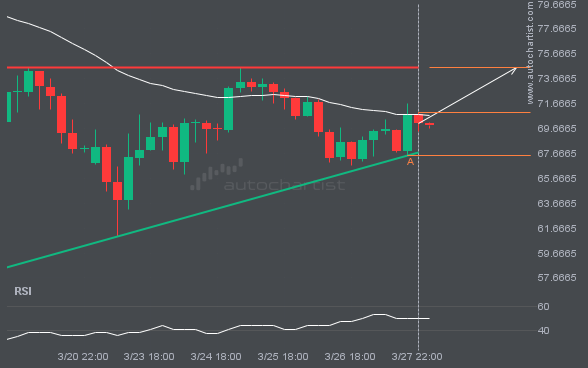
XAGUSD is approaching a resistance line of a Ascending Triangle. It has touched this line numerous times in the last 9 days.
An emerging Ascending Triangle pattern in its final wave has been identified on the XAGUSD 4 hour chart. After a strong bullish run, XAGUSD is heading toward the upper triangle trendline, with possible resistance at 74.5792. If the resistance holds, the Ascending Triangle pattern suggests a rebound toward current levels.
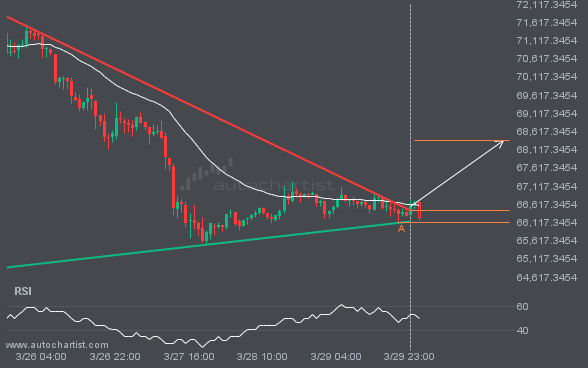
BTCUSD breaks out of a Triangle trade setup. Will it continue this trend and hit the target price?
BTCUSD has broken through a resistance line of the Triangle chart pattern. If this breakout holds, we may see the price of BTCUSD test 68370.9975 within the next 2 days. But don’t rush to trade. It has tested this line before, so confirm the breakout before taking any action.
Latest company news, corporate actions and partnership announcements
Interesting trading articles, ideas, and thought leadership
Ask your broker today or sign up for a demo from the Technical Analysis page.