Skip to content
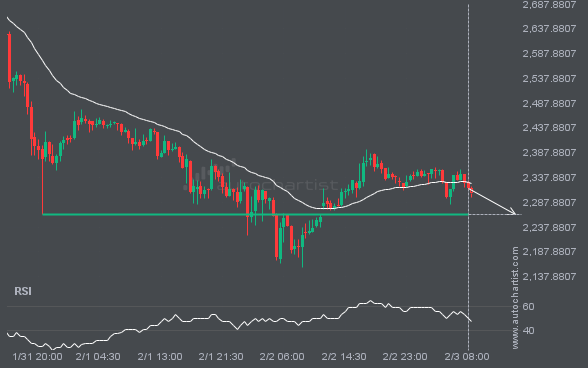
ETHUSD is approaching a critical level that could be a key deciding factor for what comes next. We may see this trajectory continue to test and break through 2264.1799, unless it loses momentum and pulls back to current levels.
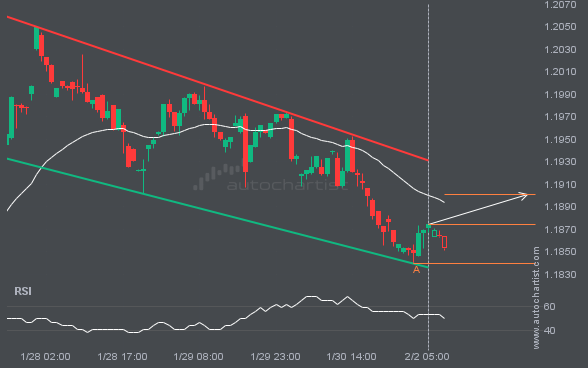
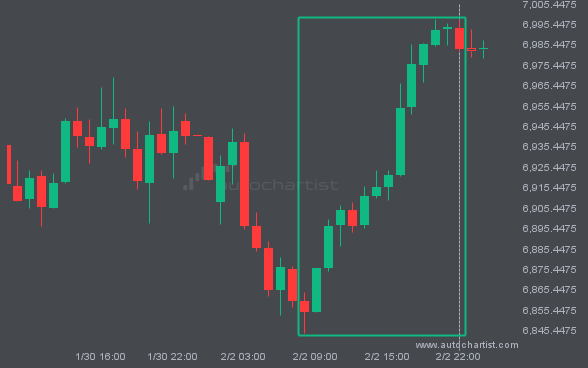
EURUSD is heading toward the resistance line in a Channel Down pattern. If this move continues, the price of EURUSD could test 1.1901 within the next 21 hours. It has tested this line many times before, so the move could be short-lived and may rebound as it has before.
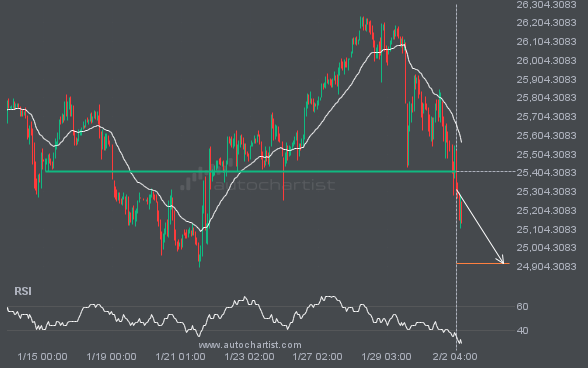
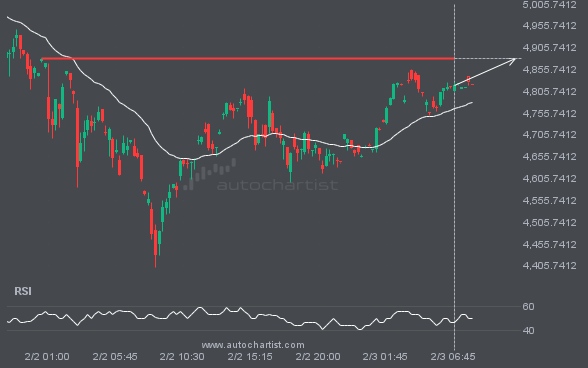
NAS100 has broken through a support line. Because it has previously retraced from this price, you should wait for confirmation of the breakout before trading. It has touched this line multiple times over the past 19 days, which suggests a possible target around 24923.1621 within the next 3 days.
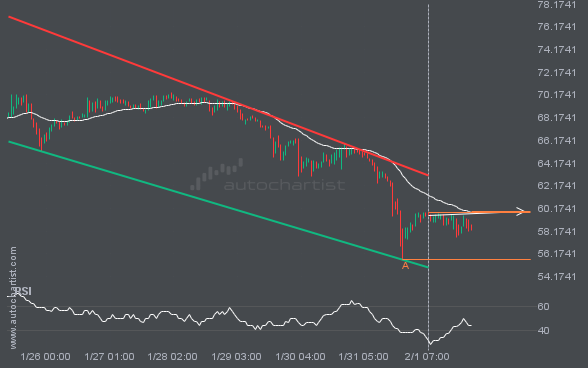
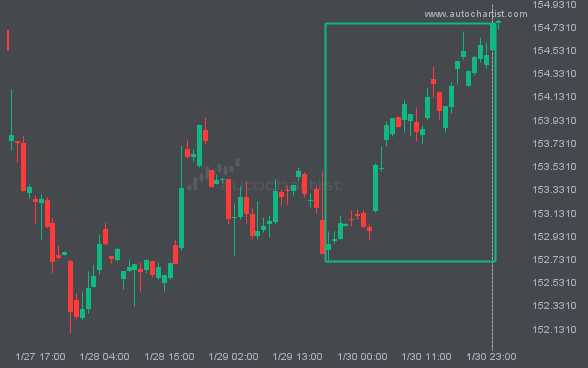
LTCUSD is moving toward a resistance line it has tested many times. It has retraced from this line before, so it’s unclear whether it will break through or rebound again. If LTCUSD continues on its current trajectory, it could reach 59.9073 within the next 2 days.