Skip to content
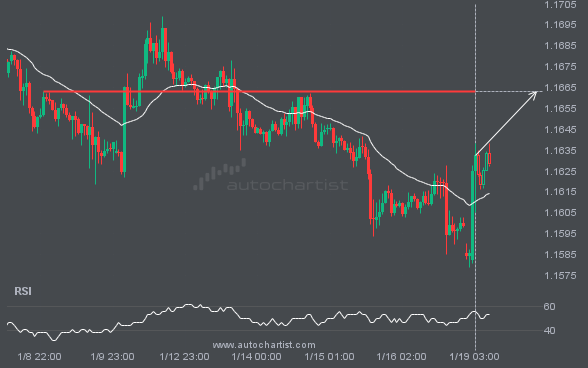
 The price of EURUSD is heading back toward the resistance area. It may struggle to break through and could reverse direction. The price may eventually break through, but it typically retreats from the level several times before doing so.
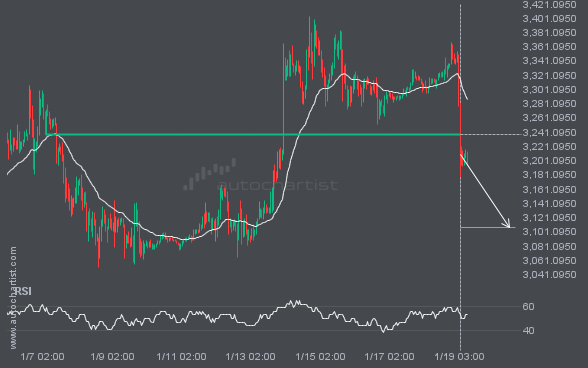
ETHUSD has broken through a support line. Since it has previously retraced from this price, wait for confirmation of the breakout before trading. It has touched this line several times over the past 13 days. This suggests a possible target around 3107.3479 within the next 3 days.

NAS100 is moving toward a support line. Since it has retraced from this line before, we may see either a breakout through it or a rebound to current levels. It has touched this line multiple times in the past 10 days and may test it again within the next 2 days.
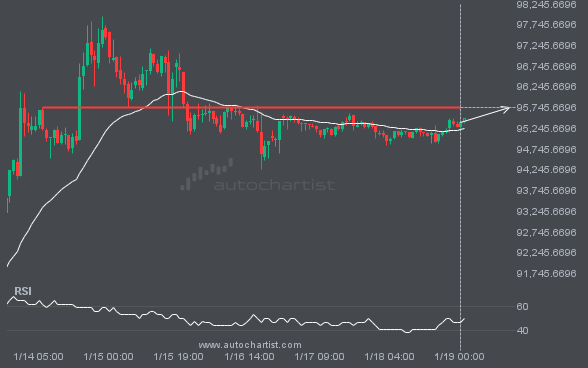
BTCUSD is approaching the line at 95754.2891. If this move continues, the price of BTCUSD could test 95754.2891 within the next 2 days. But do not rush to trade. It has tested this line many times in the past, so the move could be short-lived and end in a rebound.
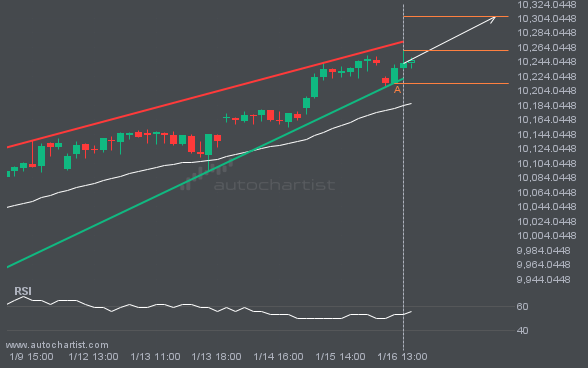
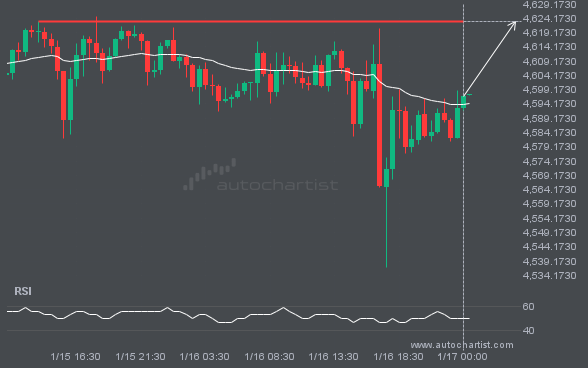
FTSE100 is moving toward a resistance line. Since it has retraced from this line before, we may see either a breakout through it or a rebound to current levels. It has touched this line multiple times in the past 8 days and may test it again within the next 12 hours.
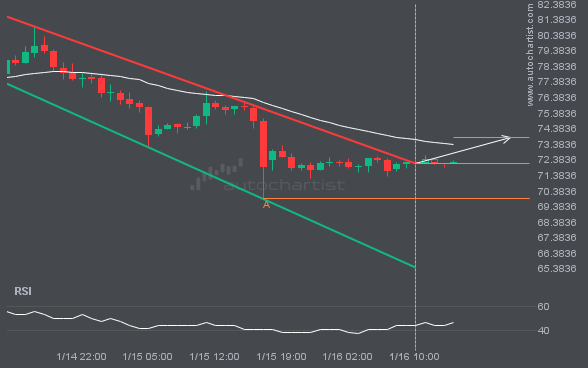
LTCUSD has broken through a resistance line of the Channel Down chart pattern. If this breakout holds, we may see the price of LTCUSD test 73.8013 within the next 9 hours. But don’t rush to trade. It has tested this line before, so confirm the breakout before taking any action.