 Skip to content
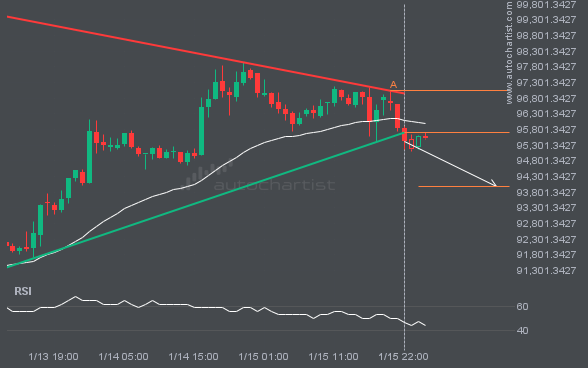
 BTCUSD has broken through the support line, which it has tested twice before. We have seen it retrace from this line before, so wait for confirmation of the breakout before trading. If this new trend persists, a target level around 93969.6210 may materialize within the next 14 hours.
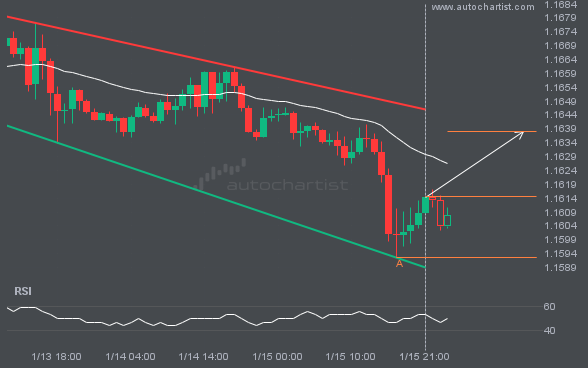
EURUSD is trapped in a Channel Down formation, implying that a breakout is imminent. This is a strong trade setup for both trend and swing traders. It is now approaching a support line that has been tested before. Divergence watchers may be optimistic about a potential breakout, which could mark the start of a new […]
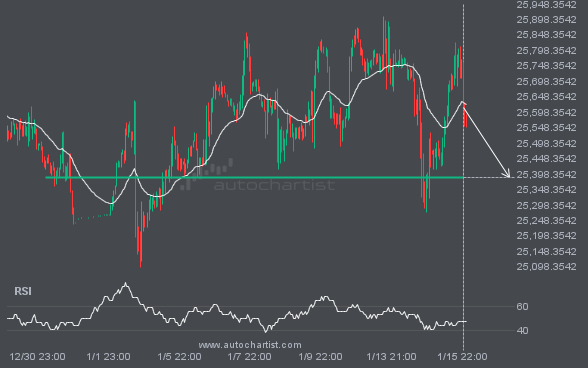
NAS100 is heading toward 25386.9648 and could reach this level within the next 3 days. It has tested this level numerous times in the past, and this time could be no different, ending in a rebound rather than a breakout. If a breakout does not occur, we may see a retracement back to current levels.
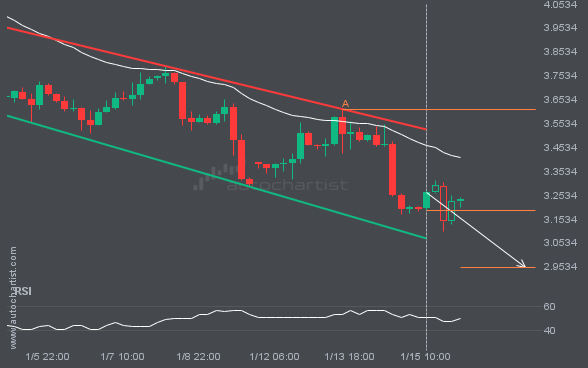
NGC/USD is moving toward a support line. Since it has retraced from this line before, we may see either a breakout through this line or a rebound to current levels. It has touched this line numerous times in the last 16 days and may test it again within the next 2 days.
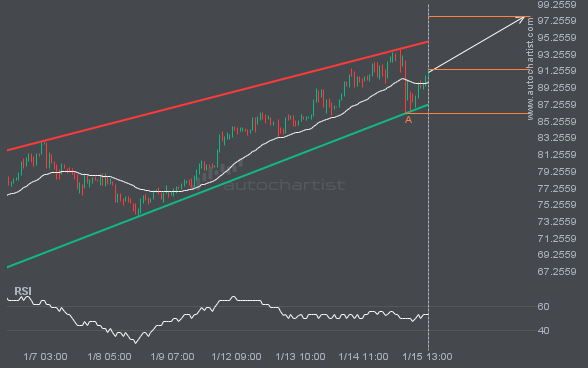
XAGUSD is moving toward a resistance line. Since it has retraced from this line before, we may see either a breakout through this line or a rebound to current levels. It has touched this line numerous times in the last 13 days and may test it again within the next 3 days.
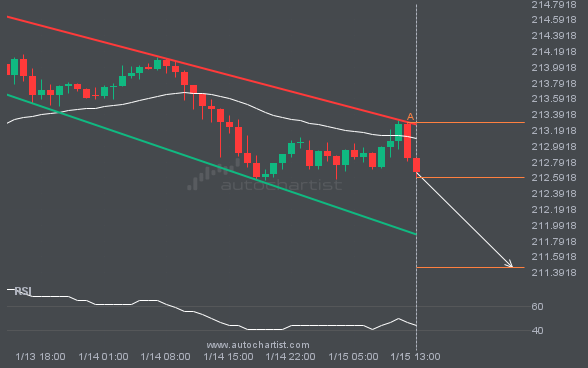
GBPJPY is moving toward a support line. Since it has retraced from this line before, we may see either a breakout through this line or a rebound to current levels. It has touched this line numerous times in the last 3 days and may test it again within the next 13 hours.
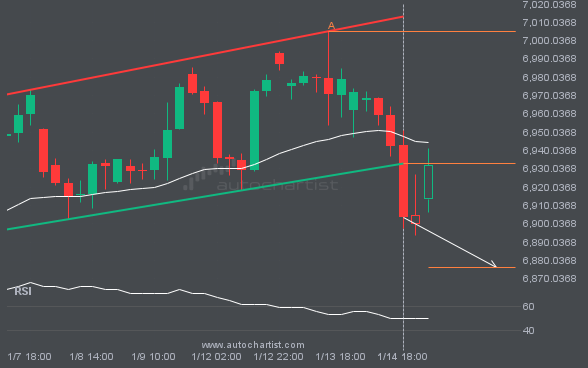
S&P500 has broken through the support line of a Channel Up technical chart pattern. Because it has retraced from this line in the past, you should wait for confirmation of the breakout before taking any action. It has touched this line twice in the last 13 days, suggesting a possible target level around 6876.2009 within […]

