Skip to content
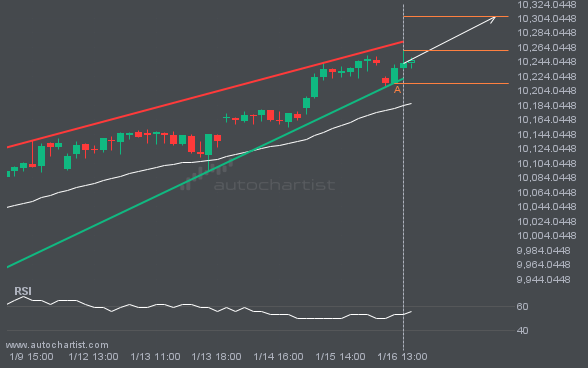
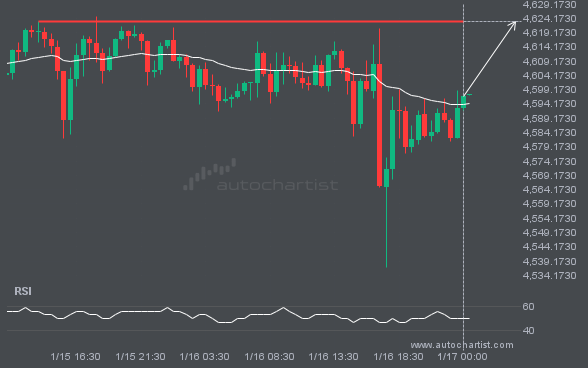
FTSE100 is moving toward a resistance line. Since it has retraced from this line before, we may see either a breakout through it or a rebound to current levels. It has touched this line multiple times in the past 8 days and may test it again within the next 12 hours.
LTCUSD has broken through a resistance line of the Channel Down chart pattern. If this breakout holds, we may see the price of LTCUSD test 73.8013 within the next 9 hours. But don’t rush to trade. It has tested this line before, so confirm the breakout before taking any action.
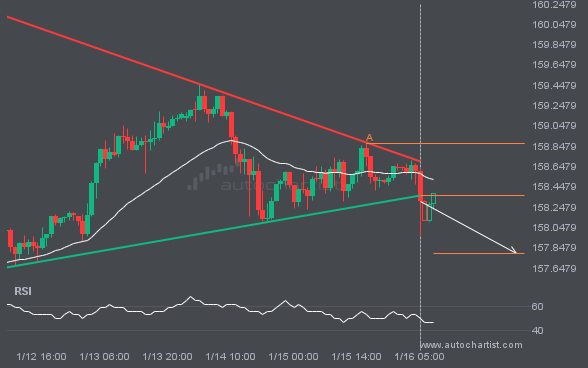
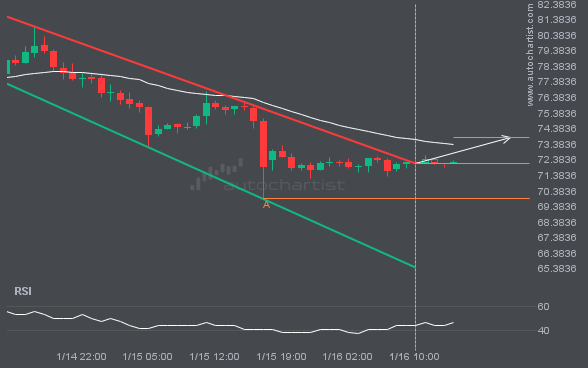
USDJPY has broken through the support line of a Triangle technical chart pattern. Because it has retraced from this line in the past, you should wait for confirmation of the breakout before taking any action. It has touched this line twice in the last 7 days, suggesting a possible target level around 157.7941 within the […]
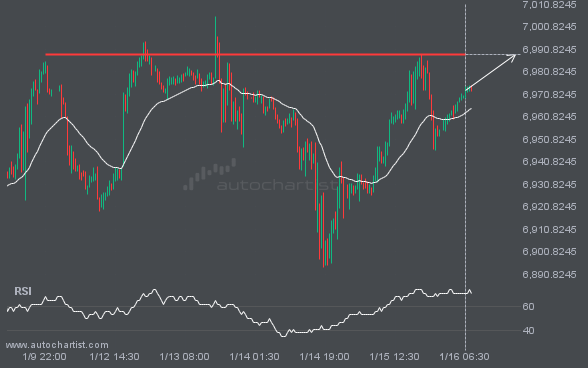
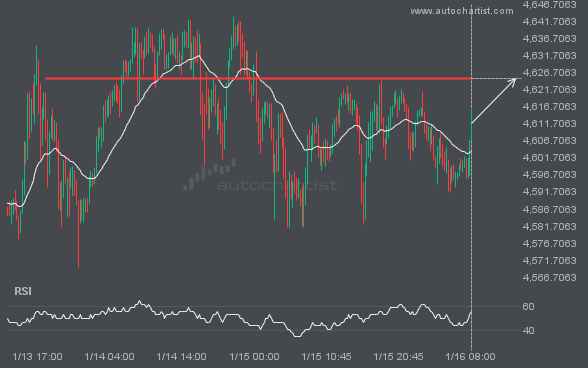
S&P500 is moving toward a key resistance level at 6988.4102. This level has been tested before for S&P500. This may present a good trading opportunity either at the spot price or after a breakout through this level.
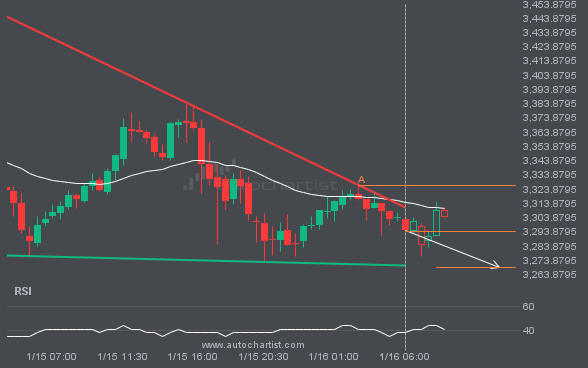
An emerging Descending Triangle pattern in its final wave has been identified on the ETHUSD 30 Minutes chart. After a strong bearish run, ETHUSD is heading toward the upper triangle trendline, with possible resistance at 3268.9400. If the support holds, the Descending Triangle pattern suggests a rebound toward current levels.