Daily Top Trade Setups: Advanced Forex, Indices, Commodities, and Stock Analysis
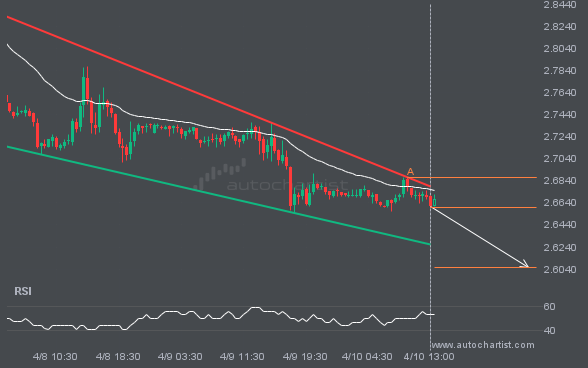
An important support line is being approached by NGC/USD. This price has been tested numerous times in the last 3 days
NGC/USD is moving toward a support line. Since it has retraced from this line before, we may see either a breakout through this line or a rebound to current levels. It has touched this line numerous times in the last 3 days and may test it again within the next 16 hours.
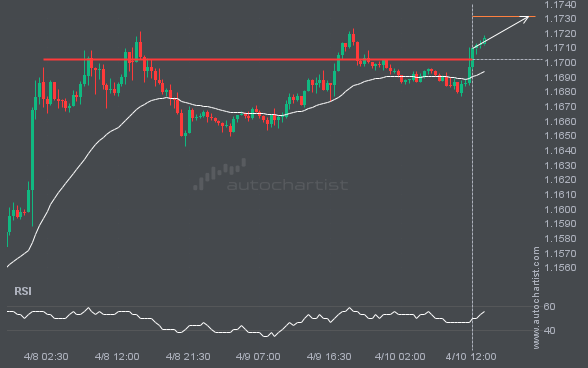
EURUSD – breach of a price line that has been tested numerous times before
EURUSD is once again retesting a key horizontal resistance level at 1.1703. This level has been tested 4 times recently and could see another bounce, as it did last time. However, after so many attempts, it may be ready to start a new trend.
LTCUSD is approaching a resistance line of a Triangle. It has touched this line numerous times in the last 3 days.
LTCUSD is moving toward a resistance line. Since it has retraced from this line before, we may see either a breakout through it or a rebound to current levels. It has touched this line multiple times in the past 3 days and may test it again within the next 19 hours.
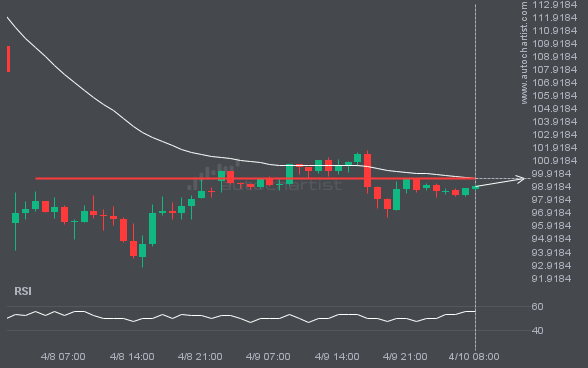
After repeatedly testing the 99.5720 level, BRN/USD is once again approaching it. Should we expect a bullish trend to follow?
BRN/USD is moving toward a level at 99.5720, which it has tested many times before. We have seen it retrace from this level before, so at this stage it isn’t clear whether it will break through this price or rebound again. If BRN/USD continues on its current trajectory, we may see it move toward 99.5720 […]
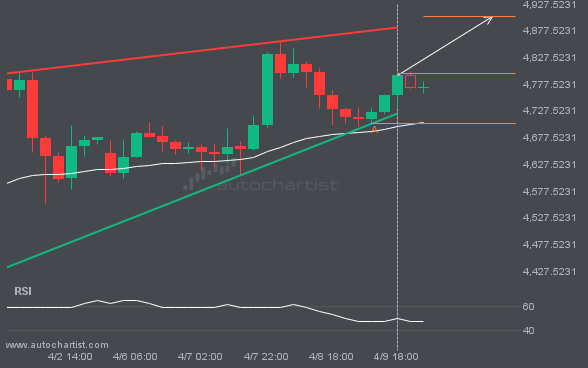
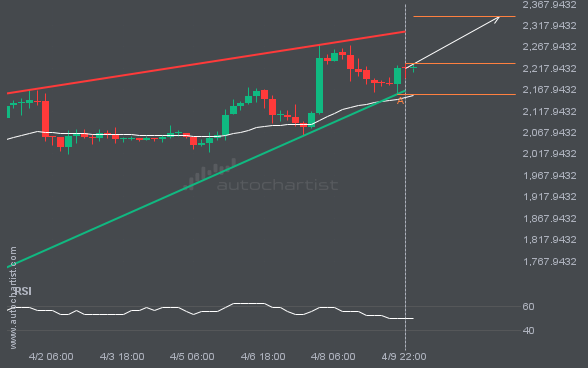
XAUUSD is approaching a resistance line of a Rising Wedge. It has touched this line numerous times in the last 14 days.
XAUUSD is trapped in a Rising Wedge formation, implying that a breakout is imminent. This is a strong trade setup for both trend and swing traders. It is now approaching a support line that has been tested before. Divergence watchers may be optimistic about a potential breakout, which could mark the start of a new […]
ETHUSD is signaling a possible trend reversal on intraday charts, as the price fails to breach support.
ETHUSD is moving toward a resistance line. Since it has retraced from this line before, we may see either a breakout through this line or a rebound to current levels. It has touched this line numerous times in the last 12 days and may test it again within the next 3 days.
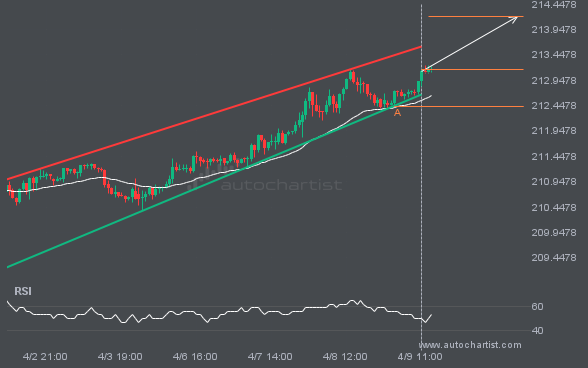
An important resistance line is being approached by GBPJPY. This price has been tested numerous times in the last 8 days
An emerging Channel Up pattern in its final wave has been identified on the GBPJPY 1 hour chart. After a strong bullish run, GBPJPY is heading toward the upper triangle trendline, with possible resistance at 214.2007. If the resistance holds, the Channel Up pattern suggests a rebound toward current levels.
Latest company news, corporate actions and partnership announcements
Interesting trading articles, ideas, and thought leadership
Ask your broker today or sign up for a demo from the Technical Analysis page.