Skip to content
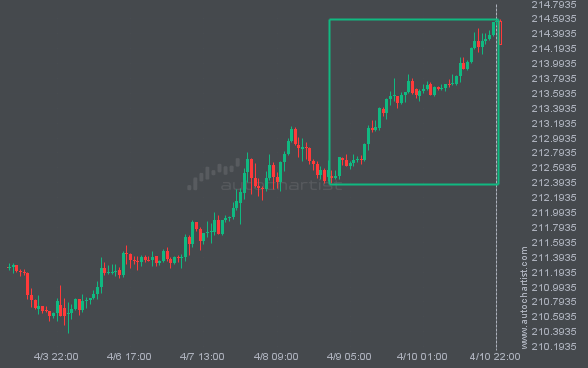
 S&P500 is heading toward the resistance line of a Channel Up pattern and could reach it within the next 3 days. It has tested this line numerous times before, and this time may be no different, ending in a rebound instead of a breakout. If a breakout doesn’t occur, we could see a retracement back […]
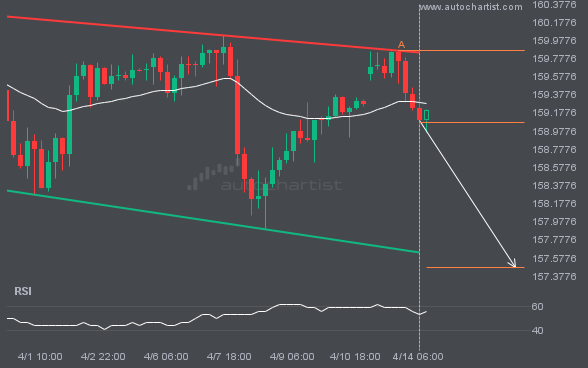
USDJPY was identified around 159.0765 after recently rebounding off the resistance on the 4 hour interval. Ultimately, the stock’s price action has formed a Channel Down pattern. This squeeze may increase the chances of a strong breakout. The projected move could take the price to around 157.4746.
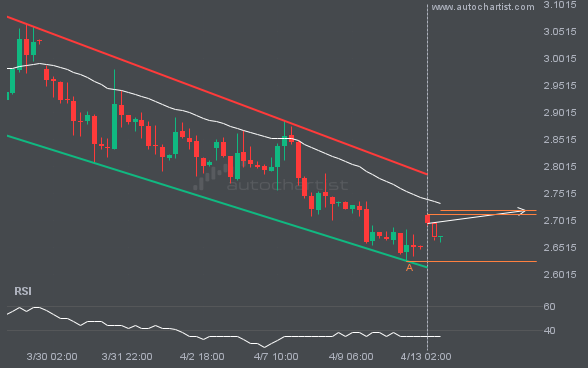
NGC/USD is moving toward a resistance line. Since it has retraced from this line before, we may see either a breakout through it or a rebound to current levels. It has touched this line multiple times in the past 20 days and may test it again within the next 3 days.
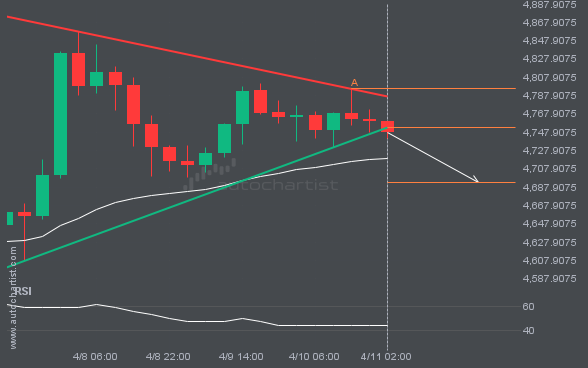
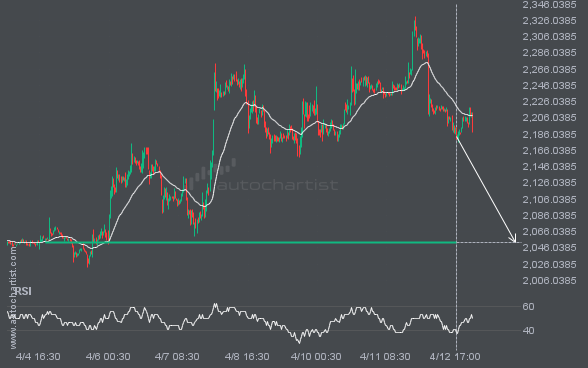
This trade setup on XAUUSD formed after a period of consolidation, during which the price moved mostly sideways before choosing a longer-term direction. Following the bearish breakout through support, the price could move toward 4693.5120.
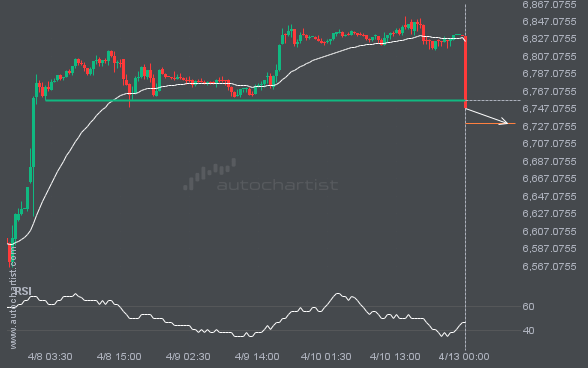
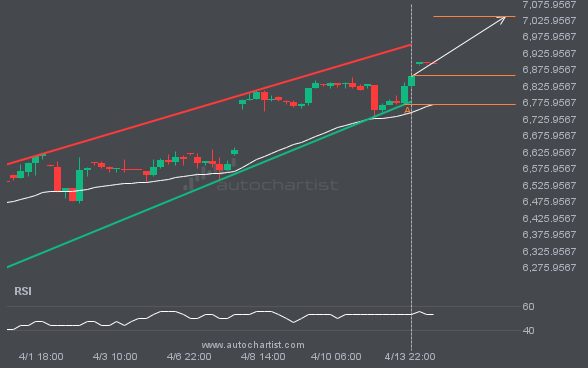
S&P500 has broken through 6756.2100, which it has tested many times before. We have also seen it retrace from this level. If this new trend persists, S&P500 may be heading towards 6730.6089 within the next 3 days.